

Submarket Report · Q4 2025 data · Commentary updated September 2026
Santa Barbara South County
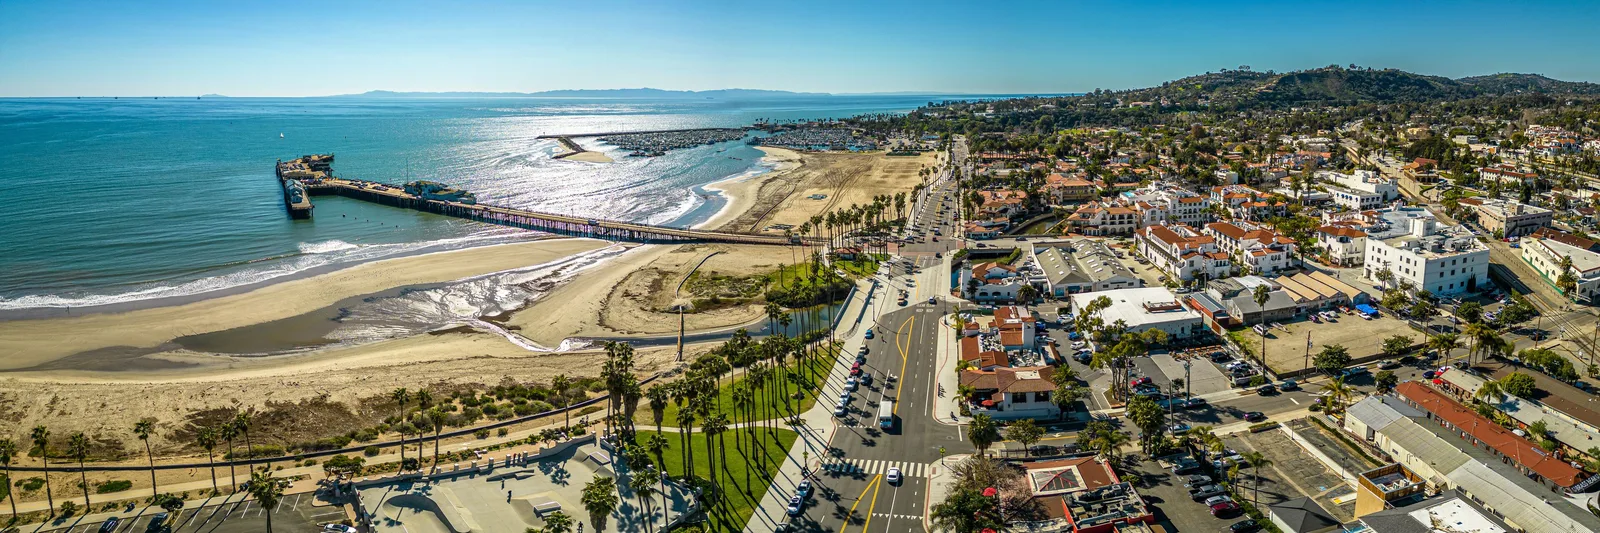
The core of the Central Coast multifamily market. Supply-constrained, RSO-regulated, and driven by a deep owner-occupant culture. Carpinteria to Goleta.
Carpinteria · Summerland · Montecito · Santa Barbara · Goleta
The Read · October 2026
What's actually happening in SB South.
Our desk closed ten South Coast transactions in 2026 through early October — roughly $46.0 million — led by the $22,500,000 sale of the 53-key Franciscan Inn & Suites in West Beach (March) and a 19-unit Goleta building at $5,400,000. The latest: 431 Ellwood Beach Drive in Goleta (7 units, $2,700,000, both sides represented) in September, then two downtown Santa Barbara buildings on October 2, 1011 Laguna Street (8 units, $2,500,000) and 333 E Carrillo Street (10 units, $3,300,000). Private-capital demand for well-located coastal assets has stayed liquid even with the City's rent rules in flux.
The regulatory picture is the story of the year. The City's temporary rent freeze (Ordinance 2026-6206) holds increases at zero through December 31, 2026. The City Council adopted the permanent ordinance October 6 on a 4–3 vote; it takes effect November 5 unless a referendum petition qualifies, with rent limits from January 1, 2027 — including a citywide rental registry that nearly every rental unit must join during 2027. Owners of pre-February 1995 buildings should underwrite the ordinance's annual-adjustment formula (60% of CPI, capped at 3%) rather than AB 1482 math.
Adaptive reuse remains the quiet opportunity: the October 2025 ordinance allows office-to-residential conversion citywide with no added parking and ministerial approval — a real option for tired downtown office product.
Regulatory Summary
The City of Santa Barbara froze rents on covered units at their December 16, 2025 levels (Ordinance 2026-6206, effective February 26 through December 31, 2026). Its permanent rent stabilization ordinance was adopted October 6, 2026 on a 4–3 vote and takes effect November 5 unless a referendum petition qualifies, with rent limits from January 1, 2027. As adopted, it covers most units with a certificate of occupancy before February 1, 1995 (single-family homes and condos are generally exempt), caps annual increases at 60% of CPI or 3%, whichever is lower, and requires nearly every rental unit in the city to register, starting in 2027. Just-cause eviction amendments were adopted in January 2026. Outside the city limits (Goleta, Carpinteria, Montecito, Summerland), AB 1482 applies — an 8.6% cap for August 2026 through July 2027 — and single-family homes and condos are exempt unless corporate-owned.
Start with our Santa Barbara rent control guide, then follow the City ordinance as it moves at sbrso.com, the Santa Barbara Rent Stabilization Observatory our team built: live status, owner costs against the cap, the council record and a fair-return calculator.
Our activity here
Own property in SB South?
Get a free Broker Opinion of Value — current comps, your rent roll, and a defensible range under the rules above. No obligation.
Request a Free ValuationInvestment Thesis · SB South
The bull & bear case.
How we frame Santa Barbara South County for buyers right now — the forces drawing capital in, and the headwinds worth underwriting before you commit.
The bull case
Why investors are buying
- Supply is effectively capped — coastline, mountains, and slow-growth politics make new product rare and protect in-place assets.
- A deep, affluent renter base (UCSB, tech, healthcare, second-home demand) keeps quality units leased through every cycle.
- An irreplaceable coastal location commands a permanent rent premium and the region’s most durable values.
- A long-term wealth-preservation play — owners underwrite for appreciation and a generational hold, not just yield.
The bear case
What's giving buyers pause
- Sub-5% cap rates — you pay up for the zip code, and current yields are thin.
- The City's rent stabilization ordinance caps yearly increases on most pre-1995 units at 60% of CPI, never more than 3%, from January 2027, limiting rent upside.
- High entry prices plus rising insurance and property taxes squeeze cash flow.
- Just-cause eviction and a strict regulatory climate make repositioning slow and management-intensive.
Proof of Work
Every SB South deal we've closed, mapped.
Our Track Record
Recent SB South closings.
| Property | Units | Sale Price | $/Door | Cap | Closed |
|---|---|---|---|---|---|
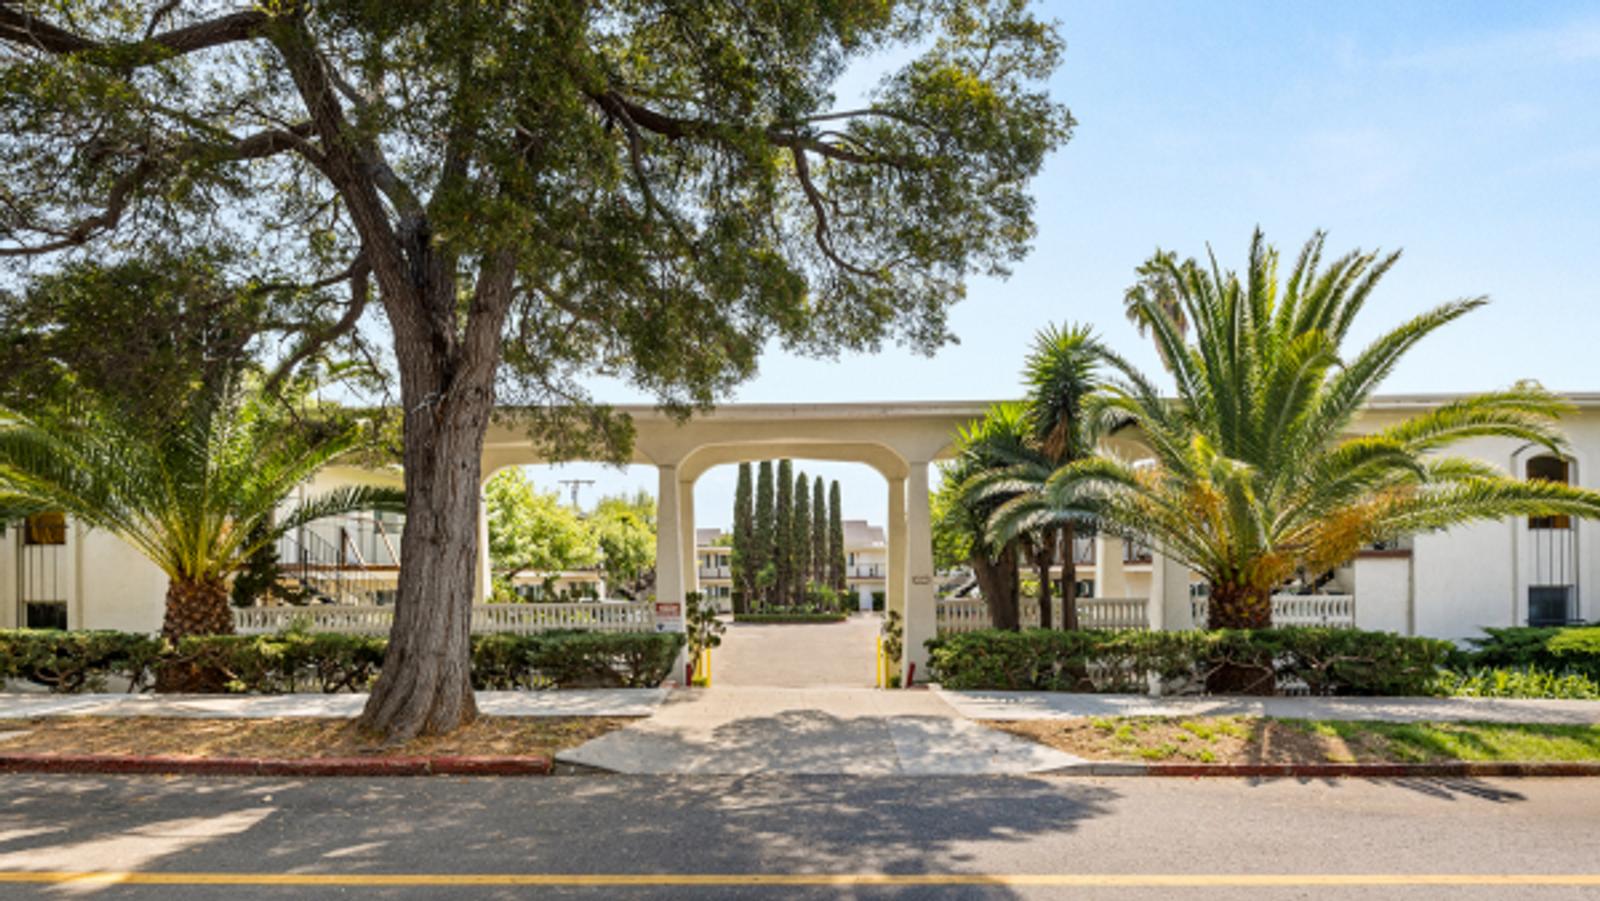
| 1011 Laguna StSanta Barbara | 8 | $2,500,000 | $313K | — | October 2026 |
| 333 E Carrillo StSanta Barbara | 10 | $3,300,000 | $330K | — | October 2026 |
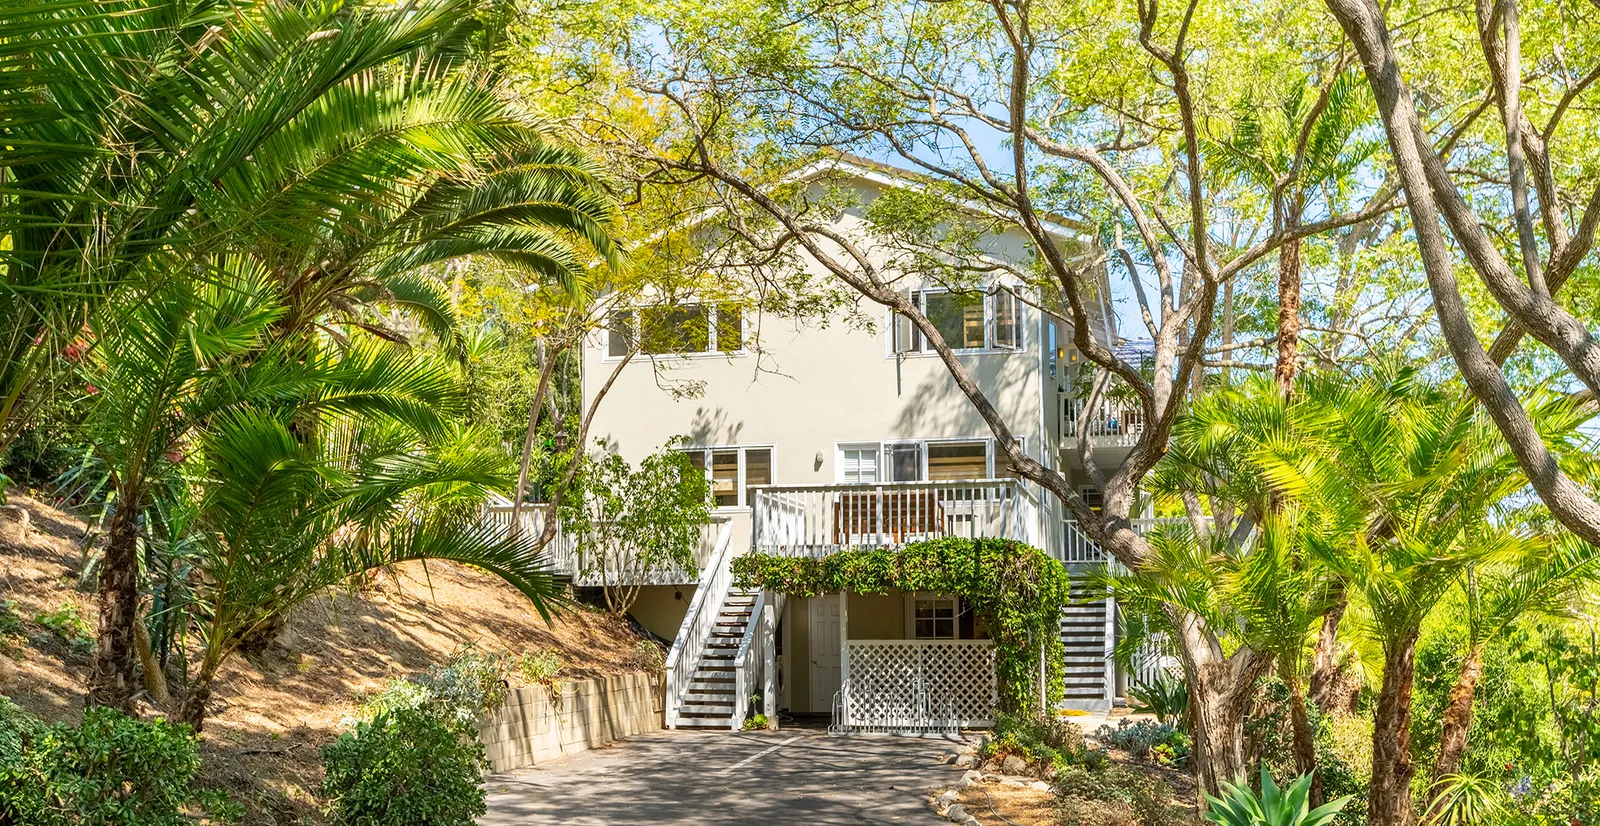
| 431 Ellwood Beach DrGoleta | 7 | $2,700,000 | $386K | — | September 2026 |
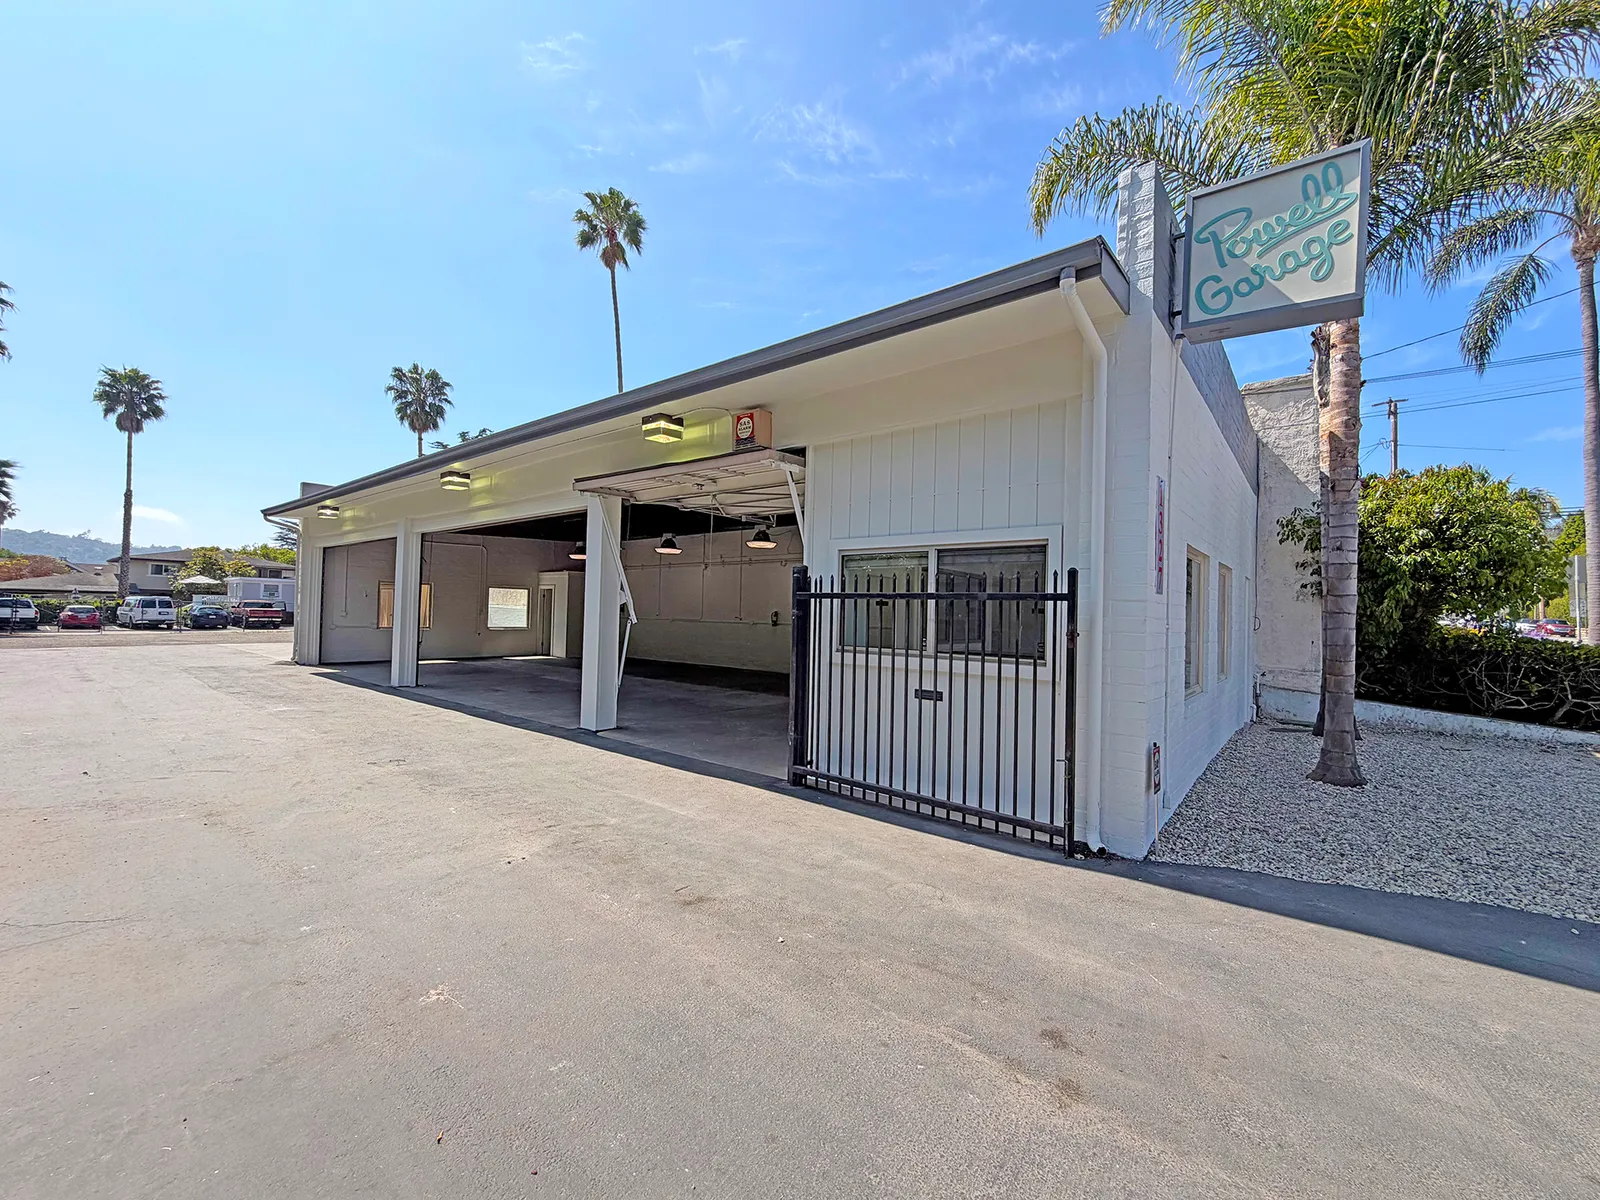
| 1327 De La Vina StSanta Barbara | — | $2,100,000 | — | — | June 2026 |
| 213 W Gutierrez StSanta Barbara | — | $1,200,000 | — | — | June 2026 |
| 1197 Calle LagunitasCarpinteria | — | $1,220,000 | — | — | April 2026 |
| 706-708 E Haley StSanta Barbara | 5 | $3,305,000 | $661K | 5.4% | April 2026 |
| 515 W Los Olivos StSanta Barbara | — | $1,770,000 | — | — | April 2026 |
Frequently Asked
Santa Barbara South County,
by the numbers.
Quick answers to the questions buyers and owners ask us most about this submarket.
The 2025 average cap rate in Santa Barbara South County was 4.93%, based on 20 closed transactions in Q4 2025. Properties traded at an average of $425,624 per door.