

Where We Work
Five submarkets, measured.
From Ventura County through SLO County, we cover every multifamily submarket on California's Central Coast — each one tracked like a research subject: pricing, regulation, supply, and the honest case for and against buying there right now.

Isla Vista
Isla Vista
About half a square mile of rentals beside UCSB, unincorporated and outside Santa Barbara's rent ordinance. Group leases on the school year, low vacancy and bedroom-driven income.
“Low vacancy: HUD's data on area student apartments show 0.7% to 4.9% since 2013, and 1.6% in 2024.”

Santa Barbara North County
Santa Maria · Orcutt · Lompoc · Solvang · Buellton · Santa Ynez · Los Olivos
Lower entry prices: Santa Maria, Lompoc and the Santa Ynez Valley averaged $178,532 per unit in 2025, well under half of South County's $425,624.
“The Central Coast’s best in-place cash flow — higher cap rates and lower entry prices.”
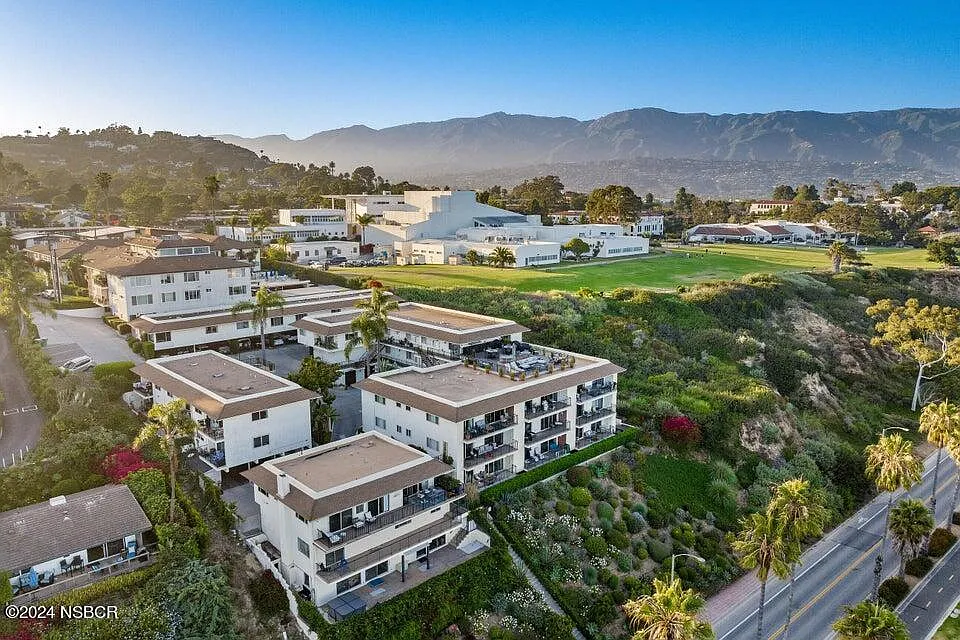
Santa Barbara South County
Carpinteria · Summerland · Montecito · Santa Barbara · Goleta
The core of the Central Coast multifamily market. Supply-constrained, RSO-regulated, and driven by a deep owner-occupant culture. Carpinteria to Goleta.
“Supply is effectively capped — coastline, mountains, and slow-growth politics make new product rare and protect in-place assets.”

San Luis Obispo County
San Luis Obispo · Five Cities · Nipomo · Atascadero · Paso Robles · Morro Bay
Cal Poly demand anchors the SLO market. Five Cities, Nipomo, and Paso Robles offer value-add opportunities with strong rent growth fundamentals.
“Cal Poly anchors steady student and young-professional demand and chronically low vacancy.”

Ventura County
Ventura · Oxnard · Camarillo · Thousand Oaks · Simi Valley · Moorpark · Fillmore · Santa Paula · Ojai · Port Hueneme
The southern gateway of the Central Coast corridor. Oxnard, Ventura, Camarillo, and the inland cities offer diverse risk profiles and some of the highest transaction volume on the Central Coast.
“The deepest inventory and most liquidity on our coverage map — more deals, easier exits.”