

Santa Barbara County · Multifamily brokerage
Santa Barbara apartment building sales
Santa Barbara is where the Golis Team started and where we have closed more apartment sales than in any other city. Inside city limits, owners now work under a local rent stabilization ordinance as well as state law, so the rules that shape value can differ from one side of the city line to the other.
Since 2003 we have closed 193 transactions in Santa Barbara, totaling 1,617 units. The most recent closed in October 2026.
Market figures are the Santa Barbara South County submarket's, which includes Santa Barbara: Radius proprietary research, calendar year 2025, vacancy as of Q4 2025. Our closings and listings are the Golis Team's own in Santa Barbara.
Track Record
What we've sold in Santa Barbara.
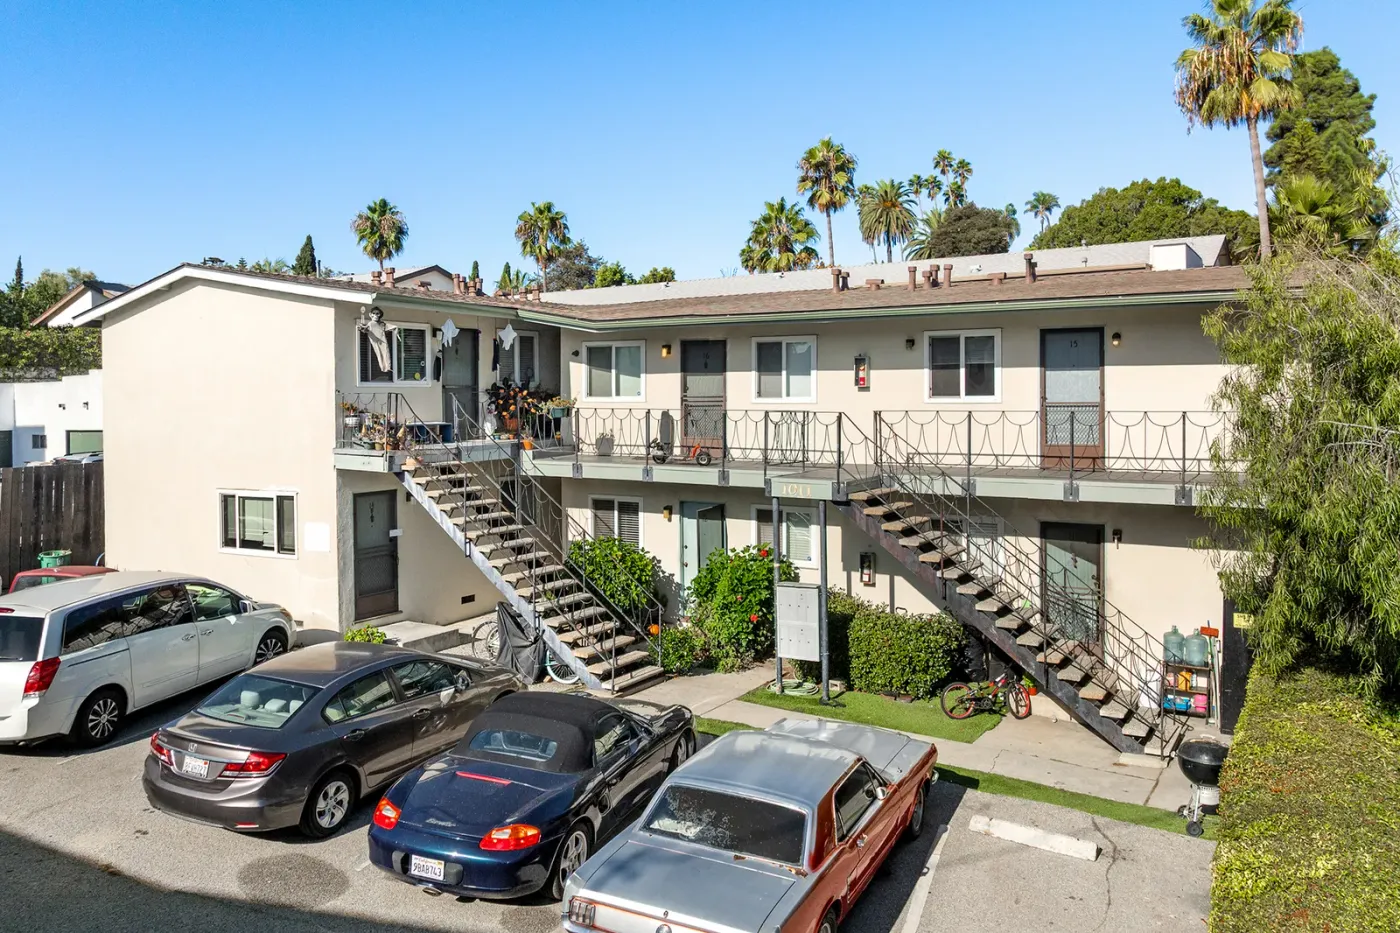
1011 Laguna St
Santa Barbara · 8 Units · Multifamily
$2,500,000 · October 2026
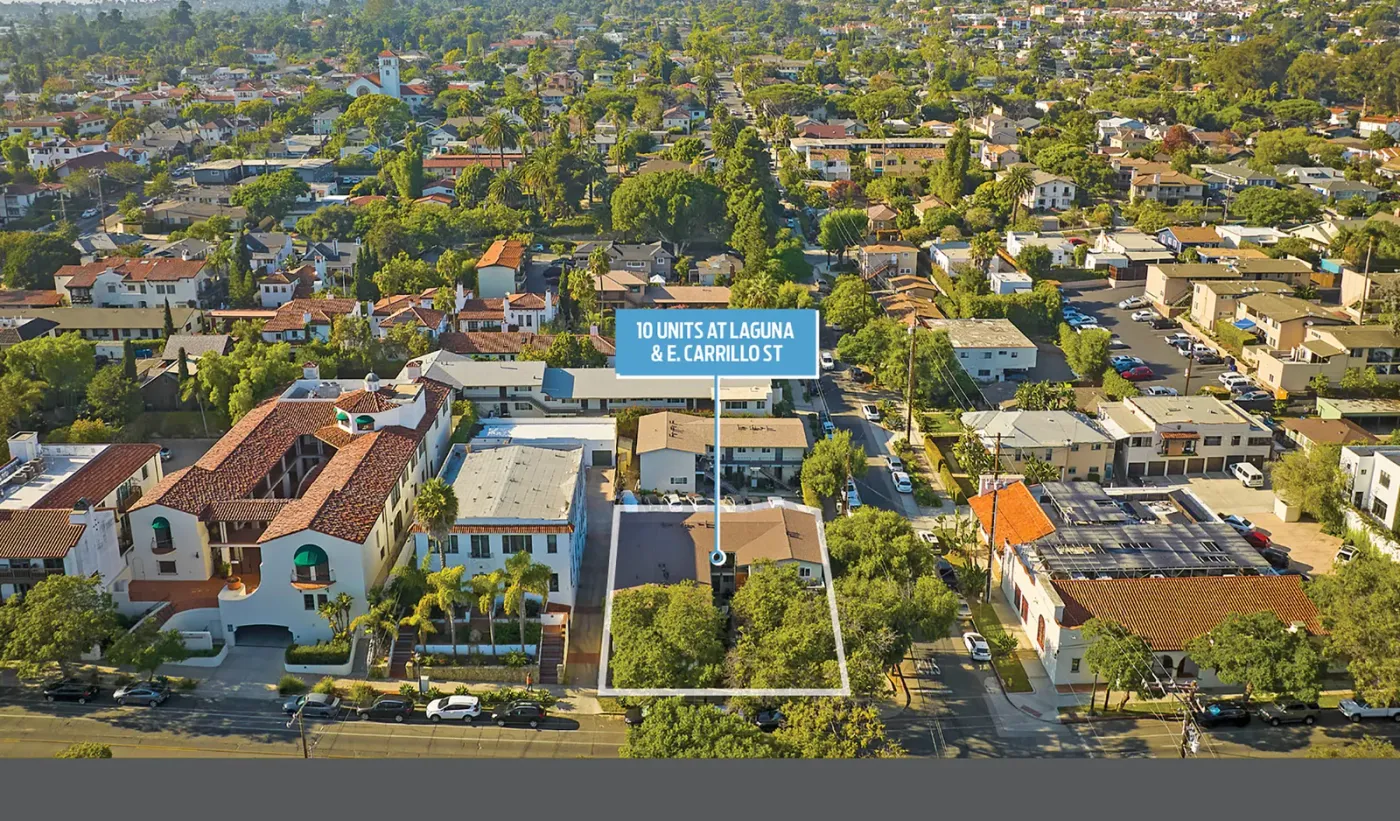
333 E Carrillo St
Santa Barbara · 10 Units · Multifamily
$3,300,000 · October 2026
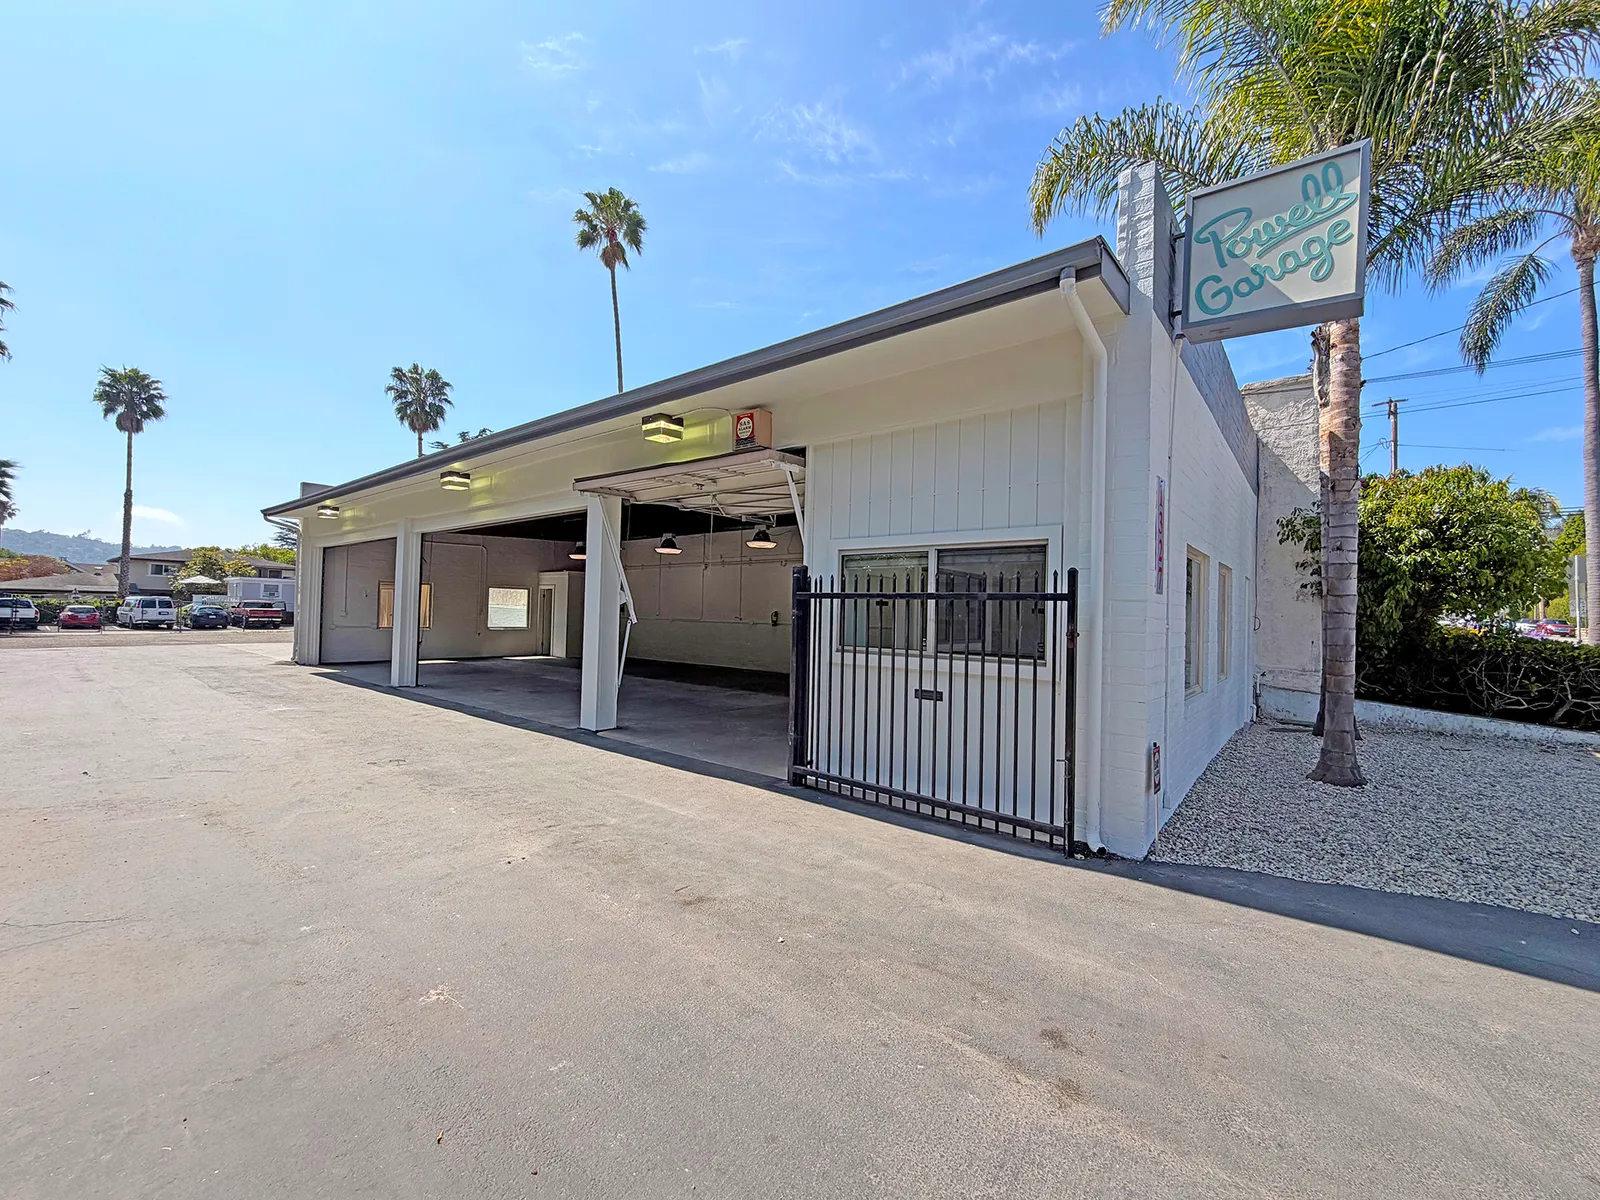
1327 De La Vina St
Santa Barbara · Commercial
$2,100,000 · June 2026
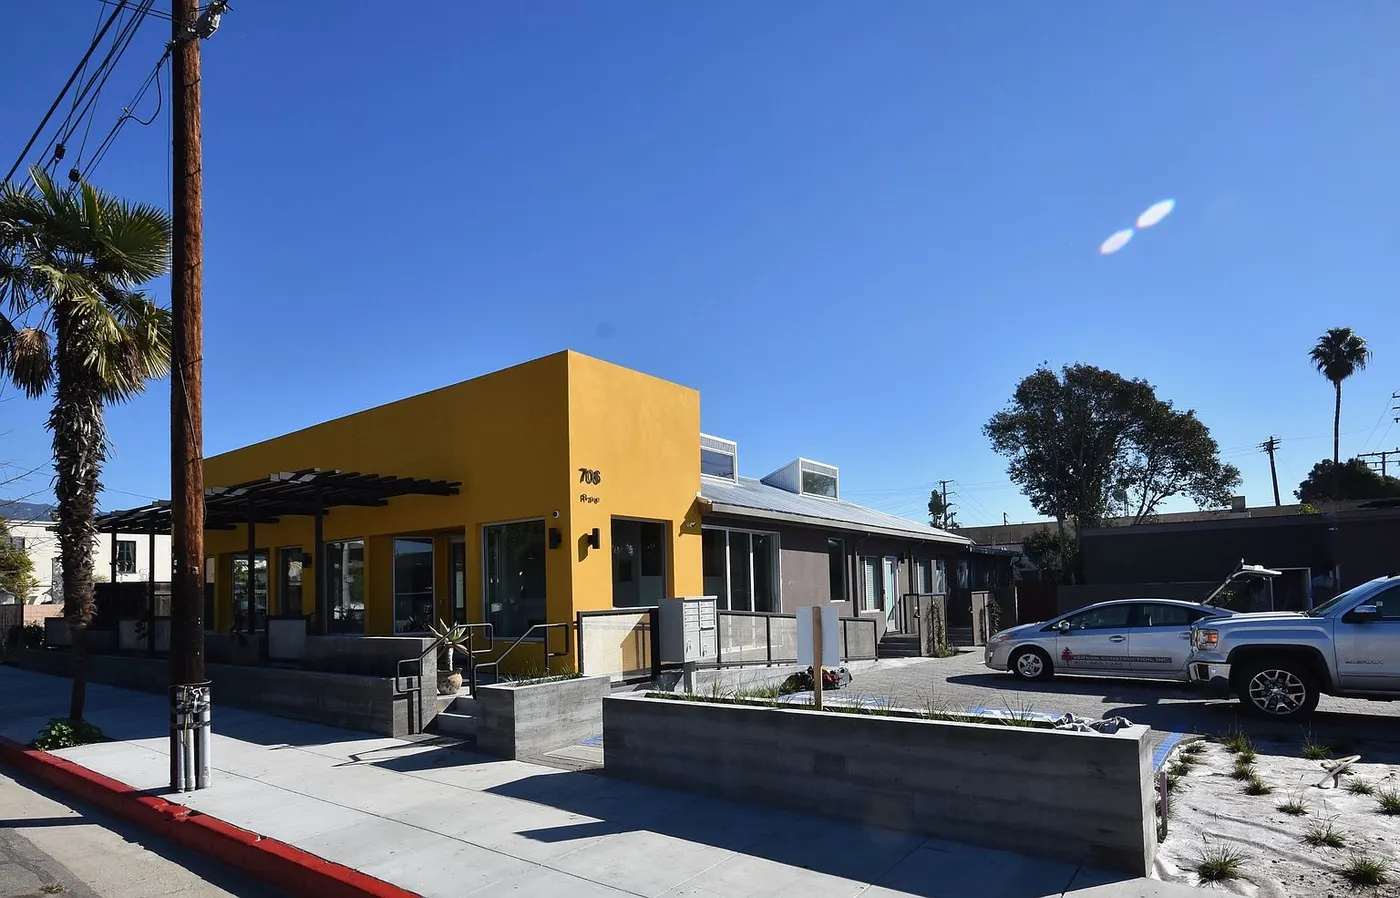
706-708 E Haley St
Santa Barbara · 5 Units · Office
$3,305,000 · April 2026
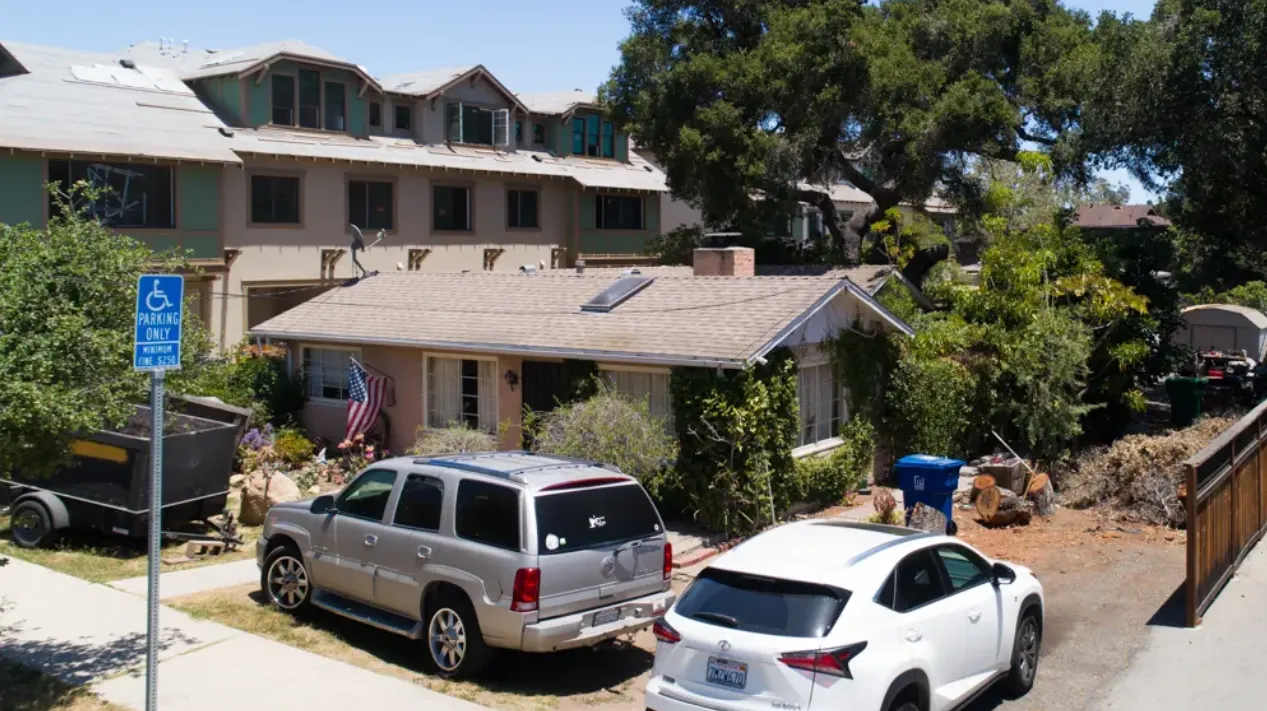
515 W Los Olivos St
Santa Barbara · Land
$1,770,000 · April 2026
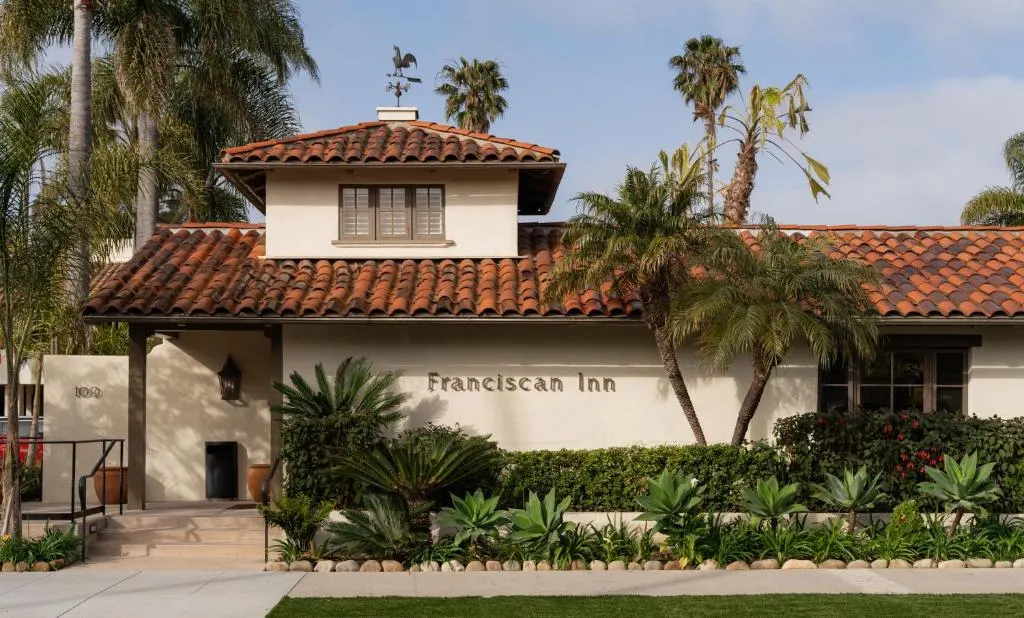
109 Bath St
Santa Barbara · 53 Units · Hospitality
$22,500,000 · March 2026
All 193 of our Santa Barbara closingsShow the list
| Property | Type | Units | Price | Per unit | Closed | We represented |
|---|---|---|---|---|---|---|
| 1011 Laguna St | Multifamily | 8 | $2,500,000 | $313K | October 2026 | Seller |
| 333 E Carrillo St | Multifamily | 10 | $3,300,000 | $330K | October 2026 | Seller |
| 1327 De La Vina St | Commercial | — | $2,100,000 | — | June 2026 | Both sides |
| 213 W Gutierrez St | Office | — | $1,200,000 | — | June 2026 | Both sides |
| 706-708 E Haley St | Office | 5 | $3,305,000 | $661K | April 2026 | Buyer |
| 515 W Los Olivos St | Land | — | $1,770,000 | — | April 2026 | Seller |
| 109 Bath St | Hospitality | 53 | $22,500,000 | $425K | March 2026 | Seller |
| 2128 Bath St | Multifamily | 4 | $2,250,000 | $563K | December 2025 | Buyer |
| 302 N Soledad St | Multifamily | 2 | $1,240,000 | $620K | December 2025 | Seller |
| 19 W Padre St | Multifamily | 7 | $2,950,000 | $421K | November 2025 | Seller |
| 15 W Islay | Multifamily | 5 | $2,210,000 | $442K | October 2025 | Seller |
| 404-414 Por La Mar Dr | Industrial | — | $4,300,000 | — | September 2025 | Seller |
| 811 E Gutierrez St & 816 Reddick St | Industrial | — | $1,630,000 | — | July 2025 | Seller |
| 622 & 630 E Victoria St | Multifamily | 16 | $5,850,000 | $366K | June 2025 | Buyer |
| 15 W Islay | Multifamily | 5 | $1,850,000 | $370K | May 2025 | Both sides |
| 20-80 Oceano Ave | Multifamily | 29 | $21,150,000 | $729K | February 2025 | Both sides |
| 526-528 N Milpas St | Office | — | $1,050,000 | — | November 2024 | Seller |
| 2016-2018 Bath St | Multifamily | 8 | $4,700,000 | $588K | October 2024 | Both sides |
| 2011 Oak Ave | Multifamily | 8 | $2,750,000 | $344K | September 2024 | Both sides |
| 105 San Angelo Ave | Land | — | $3,070,000 | — | July 2024 | Buyer |
| 208 W Arrellaga St | Multifamily | 4 | $1,629,375 | $407K | July 2024 | Seller |
| 901-905 Garcia Rd | Multifamily | 4 | $2,200,000 | $550K | June 2024 | Seller |
| 4834 San Gordiano Ave | Multifamily | 4 | $3,200,000 | $800K | June 2024 | Both sides |
| 1715 De La Vina St | Multifamily | 2 | $1,290,000 | $645K | May 2024 | Seller |
| 1721 De La Vina St | Multifamily | 4 | $2,590,000 | $648K | May 2024 | Seller |
| 1514-1520 Garden St | Multifamily | 11 | $7,250,000 | $659K | May 2024 | Seller |
| 400 W Pedregosa St | Multifamily | 3 | $1,675,000 | $558K | March 2024 | Buyer |
| 234 S Voluntario St & 1015 Hutash St | Multifamily | 20 | $9,350,000 | $468K | December 2023 | Both sides |
| 329 W Micheltorena Street | Multifamily | 2 | $1,400,000 | $700K | September 2023 | Buyer |
| 133 & 135 E Ortega St | Industrial | — | $6,550,000 | — | April 2023 | Buyer |
| 117 E Ortega St | Office | — | $2,000,000 | — | April 2023 | Buyer |
| 130 W Padre St | Multifamily | 8 | $2,800,000 | $350K | March 2023 | Seller |
| 4000 Modoc Rd | Office | — | $2,170,000 | — | February 2023 | Both sides |
| 117-119 N Milpas St | Multifamily | 5 | $1,650,000 | $330K | February 2023 | Both sides |
| 4085 State St | Land | — | $3,025,000 | — | February 2023 | Seller |
| 1317 Punta Gorda St | Land | 14 | $3,850,000 | $275K | December 2022 | Seller |
| 28 W Pedregosa St | Multifamily | 14 | $6,450,000 | $461K | December 2022 | Both sides |
| 4834 San Gordiano Ave | Multifamily | 4 | $2,125,000 | $531K | November 2022 | Buyer |
| 1315 State St | Retail | — | $2,700,000 | — | November 2022 | Seller |
| 321 W Padre St | Multifamily | 11 | $5,750,000 | $523K | October 2022 | Buyer |
| 1418 Almond Ave | Multifamily | 3 | $1,950,000 | $650K | September 2022 | Seller |
| 515 E Arrellaga St | Multifamily | 17 | $6,595,000 | $388K | September 2022 | Seller |
| 515 E Arrellaga St | Multifamily | 17 | $2,050,000 | $121K | September 2022 | Seller |
| 4820 San Gordiano Ave | Multifamily | 4 | $2,175,000 | $544K | September 2022 | Seller |
| 520 E Haley St | Industrial | — | $1,700,000 | — | August 2022 | Both sides |
| 1111 Quinientos St | Multifamily | 1 | $1,200,000 | — | August 2022 | Both sides |
| 2024 Anacapa St | Multifamily | 9 | $4,000,000 | $444K | June 2022 | Both sides |
| 1628 San Andres St | Multifamily | 3 | $1,960,000 | $653K | June 2022 | Seller |
| 109 Bath St | Hospitality | 53 | $22,000,000 | $415K | March 2022 | Buyer |
| 308 W De La Guerra St | Multifamily | 4 | $1,730,000 | $433K | March 2022 | Seller |
| 326 W Victoria St | Multifamily | 4 | $2,300,000 | $575K | February 2022 | Seller |
| 211-215 W De la Guerra St | Multifamily | 4 | $2,475,000 | $619K | December 2021 | Seller |
| 4455 Hollister Ave | Multifamily | 11 | $3,095,000 | $281K | November 2021 | Seller |
| 134 Chapala St | Hospitality | — | $3,750,000 | — | October 2021 | Seller |
| 55 Ocean View Ave | Multifamily | 11 | $6,900,000 | $627K | September 2021 | Seller |
| 614-618 W Pedregosa St | Multifamily | 10 | $4,100,000 | $410K | August 2021 | Both sides |
| 8 Ocean View Ave | Land | — | $1,600,000 | — | July 2021 | Buyer |
| 817 De La Vina St | Multifamily | 7 | $2,920,500 | $417K | June 2021 | Buyer |
| 160 Camino De Vida | Multifamily | 12 | $4,200,000 | $350K | February 2021 | Buyer |
| 2015 Castillo St | Multifamily | 6 | $2,775,000 | $463K | February 2021 | Both sides |
| 2130 Bath St | Multifamily | 4 | $2,000,000 | $500K | December 2020 | Seller |
| 1530 Bath St | Multifamily | 5 | $2,580,000 | $516K | December 2020 | Both sides |
| 615 W Mission St | Multifamily | 3 | $1,630,000 | $543K | November 2020 | Seller |
| 1615 Garden St | Multifamily | 2 | $1,040,000 | $520K | September 2020 | Buyer |
| 305 Ladera St | Multifamily | 4 | $2,235,000 | $559K | September 2020 | Both sides |
| 1418 Almond Ave | Multifamily | 3 | $1,590,000 | $530K | August 2020 | Seller |
| 410 E Islay Street | Multifamily | 2 | $1,295,000 | $648K | July 2020 | Seller |
| 428 Chapala St | Office | — | $2,440,000 | — | June 2020 | Buyer |
| 401 W Los Olivos | Multifamily | 18 | $4,700,000 | $261K | January 2020 | Seller |
| 1407 Bath St | Multifamily | 6 | $1,781,000 | $297K | December 2019 | Both sides |
| 1628 San Andres St | Multifamily | 3 | $1,450,000 | $483K | August 2019 | Buyer |
| 523 W Islay St | Multifamily | 2 | $785,000 | $393K | August 2019 | Seller |
| 1822 San Andres | Multifamily | 2 | $785,000 | $393K | July 2019 | Buyer |
| 28 W Pedregosa St | Multifamily | 14 | $4,250,000 | $304K | July 2019 | Seller |
| 1410 San Andres | Multifamily | — | $950,000 | — | June 2019 | Buyer |
| 328 W Montecito St | Land | — | $1,350,000 | — | June 2019 | Buyer |
| 1501 Santa Barbara St | Multifamily | 8 | $4,394,000 | $549K | January 2019 | Seller |
| 114 Natoma Ave | Multifamily | 8 | $3,145,000 | $393K | December 2018 | Seller |
| 4085 State St | Land | — | $2,550,000 | — | August 2018 | Both sides |
| 2509 Modoc Rd | Multifamily | 2 | $845,000 | $423K | June 2018 | Seller |
| 309 W Quinto Street | Office | — | $2,533,200 | — | June 2018 | Seller |
| 215 W Arrellaga St | Multifamily | 10 | $3,700,000 | $370K | April 2018 | Both sides |
| 1821 De La Vina St | Multifamily | 6 | $2,100,000 | $350K | December 2017 | Seller |
| 55 Ocean View Ave | Multifamily | 11 | $4,275,000 | $389K | November 2017 | Both sides |
| 1801 De La Vina St | Multifamily | 4 | $1,790,000 | $448K | August 2017 | Seller |
| 47 Ocean View Ave | Multifamily | 15 | $4,175,000 | $278K | August 2017 | Seller |
| 2509 Modoc Rd | Multifamily | 2 | $785,000 | $393K | March 2017 | Seller |
| 536 Brinkerhoff Ave | Office | 2 | $1,357,000 | $679K | January 2017 | Seller |
| 411 E Micheltorena St | Multifamily | 6 | $2,295,000 | $383K | October 2016 | Buyer |
| 1236 San Andres St | Multifamily | 2 | $870,000 | $435K | October 2016 | Buyer |
| 502 Brinkerhoff | Retail | — | $855,000 | — | September 2016 | Buyer |
| 520 - 536 W Carrillo | Multifamily | 50 | $14,875,000 | $298K | September 2016 | Seller |
| 229 W Quinto St | Multifamily | 5 | $1,985,000 | $397K | September 2016 | Seller |
| 1532 Anacapa St | Office | — | $3,250,000 | — | August 2016 | Both sides |
| 806 N Nopal St | Multifamily | 8 | $2,050,000 | $256K | July 2016 | Buyer |
| 2504-2506 Oak Crest Dr | Multifamily | 2 | $950,000 | $475K | June 2016 | Seller |
| 1117 Quinientos St | Multifamily | 4 | $1,525,000 | $381K | June 2016 | Seller |
| 1407 Bath St | Multifamily | 6 | $1,475,000 | $246K | May 2016 | Both sides |
| 517 Chapala St | Land | — | $2,100,000 | — | May 2016 | Buyer |
| 2019 State St | Office | — | $1,500,000 | — | April 2016 | Seller |
| 440 E Ortega St | Retail | — | $600,000 | — | March 2016 | Seller |
| 4345 Modoc | Multifamily | 2 | $1,500,000 | $750K | February 2016 | Buyer |
| 232 W Yanonali | Multifamily | 6 | $2,442,500 | $407K | January 2016 | Seller |
| 2015 Castillo St | Multifamily | 6 | $1,950,000 | $325K | December 2015 | Buyer |
| 315 E Carrillo St | Retail | — | $750,000 | — | December 2015 | Both sides |
| 211 W Mission | Office | — | $620,000 | — | November 2015 | Buyer |
| 1530 Bath St | Multifamily | 5 | $1,725,000 | $345K | October 2015 | Both sides |
| 802-808 N Voluntario St | Multifamily | 4 | $1,725,000 | $431K | October 2015 | Both sides |
| 101 S Canada St | Multifamily | 1 | $895,000 | — | August 2015 | Both sides |
| 4515-4519 Hollister Ave | Office | — | $2,125,000 | — | May 2015 | Buyer |
| 302 W Montecito | Multifamily | — | $1,480,000 | — | April 2015 | Both sides |
| 308 W Montecito St | Land | — | $865,000 | — | December 2014 | Buyer |
| 311 W Montecito St | Office | — | $725,000 | — | December 2014 | Both sides |
| 1334 Anacapa St | Office | — | $2,647,000 | — | November 2014 | Buyer |
| 203 Ladera St | Multifamily | 29 | $7,000,000 | $241K | September 2014 | Both sides |
| 222 W Mission St | Multifamily | 9 | $2,040,000 | $227K | September 2014 | Buyer |
| 118 E Sola St | Multifamily | 14 | $4,750,000 | $339K | August 2014 | Both sides |
| 1502 San Pascual St | Multifamily | 45 | $12,500,000 | $278K | August 2014 | Both sides |
| 533 E Micheltorena St | Office | — | $954,500 | — | February 2014 | Seller |
| 533 E Micheltorena St | Office | — | $148,200 | — | February 2014 | Seller |
| 533 E Micheltorena St | Office | — | $222,300 | — | February 2014 | Seller |
| 801-831 Cliff Dr | Multifamily | 97 | $33,500,000 | $345K | January 2014 | Both sides |
| 118 Los Aguajes Ave | Multifamily | 11 | $3,062,500 | $278K | January 2014 | Seller |
| 210 W Micheltorena St | Multifamily | 6 | $1,700,000 | $283K | January 2014 | Seller |
| 527 E Micheltorena St | Multifamily | 2 | $1,300,000 | $650K | December 2013 | Buyer |
| 2320 De La Vina St | Multifamily | 13 | $2,850,000 | $219K | September 2013 | Seller |
| 500 N Milpas St | Retail | — | $422,500 | — | July 2013 | Seller |
| 321 W Padre St | Multifamily | 11 | $2,150,000 | $195K | July 2013 | Both sides |
| 104 Chapala St & 28 W Mason St | Multifamily | 8 | $2,050,000 | $256K | May 2013 | Seller |
| 1125 De La Vina St | Multifamily | 9 | $2,371,600 | $264K | May 2013 | Seller |
| 210 Arden Rd | Multifamily | 3 | $845,000 | $282K | March 2013 | Seller |
| 2504-2506 Oak Crest Dr | Multifamily | 2 | $769,500 | $385K | December 2012 | Buyer |
| 504 W Pueblo St | Office | — | $315,000 | — | October 2012 | Buyer |
| 821 Bond Ave | Industrial | — | $296,000 | — | July 2012 | Both sides |
| 515 Red Rose Ln | Multifamily | 32 | $8,970,000 | $280K | July 2012 | Seller |
| 85 N La Cumbre Rd | Multifamily | 10 | $1,716,667 | $172K | March 2012 | Buyer |
| 320 -322 W Canon Perdido St | Multifamily | 29 | $4,650,000 | $160K | January 2012 | Buyer |
| 1212 -1216 Alta Vista Rd | Multifamily | 10 | $2,760,000 | $276K | July 2011 | Both sides |
| 203 Ladera St | Multifamily | 29 | $4,650,000 | $160K | June 2011 | Both sides |
| 902 Bath St | Multifamily | 15 | $2,050,000 | $137K | October 2010 | Seller |
| 1510 Laguna St | Multifamily | 7 | $1,435,000 | $205K | October 2010 | Seller |
| 3022 State St | Office | — | $1,150,000 | — | September 2010 | Seller |
| 411 E Micheltorena St | Multifamily | 6 | $1,225,000 | $204K | August 2010 | Seller |
| 148 E Carrillo St | Office | — | $700,000 | — | July 2010 | Seller |
| 4839 San Gordiano Ave | Multifamily | 4 | $1,120,000 | $280K | April 2010 | Seller |
| 26 W Arrellaga St | Multifamily | 12 | $2,193,750 | $183K | October 2009 | Seller |
| 150 Pebble Hill Dr | Land | — | $2,000,000 | — | July 2009 | Seller |
| 122 W Valerio St | Multifamily | 10 | $1,750,000 | $175K | April 2009 | Seller |
| 2541 Modoc Rd | Multifamily | 37 | $8,200,000 | $222K | February 2008 | Buyer |
| 1826 -1820/1822 De La Vina St | Land | — | $3,450,000 | — | September 2007 | Seller |
| 25 Broadmoor Plz | Multifamily | 7 | $1,650,000 | $236K | May 2007 | Seller |
| 126 E Canon Perdido St | Retail | — | $3,010,000 | — | March 2007 | Seller |
| 2121 Oak Park Ln | Land | — | $1,350,000 | — | March 2007 | Both sides |
| 554 & 555 Coronel Pl | Multifamily | 49 | $11,770,500 | $240K | February 2007 | Buyer |
| 3754 San Remo Dr | Multifamily | 29 | $7,695,000 | $265K | February 2007 | Buyer |
| 134 Chapala St | Hospitality | — | $2,600,000 | — | December 2006 | Seller |
| 227 E Haley St | Multifamily | 14 | $1,400,000 | $100K | November 2006 | Seller |
| 530 W Anapamu St | Multifamily | 13 | $3,300,000 | $254K | July 2006 | Seller |
| 505 W Los Olivos St | Multifamily | 4 | $1,995,000 | $499K | July 2006 | Both sides |
| 1215 and 1217 (Price Reduced) Laguna St | Multifamily | 6 | $1,425,000 | $238K | June 2006 | Both sides |
| 224 E Figueroa St | Multifamily | 5 | $1,400,000 | $280K | June 2006 | Buyer |
| 620 W Gutierrez St | Multifamily | 74 | $13,950,000 | $189K | February 2006 | Seller |
| 47 Ocean View Ave | Multifamily | 26 | $5,975,000 | $230K | December 2005 | Seller |
| 1905 De La Vina St | Multifamily | 16 | $3,495,000 | $218K | November 2005 | Both sides |
| 3450 Richland Dr | Multifamily | 7 | $1,935,000 | $276K | October 2005 | Seller |
| 3442 Richland Dr | Multifamily | 7 | $1,550,000 | $221K | October 2005 | Buyer |
| 314 W Micheltorena St | Multifamily | 14 | $2,675,000 | $191K | September 2005 | Both sides |
| 924 Philinda Ave | Multifamily | 8 | $1,725,000 | $216K | May 2005 | Seller |
| 930 Philinda | Multifamily | 4 | $1,725,000 | $431K | March 2005 | Seller |
| 3449 Richland Dr | Multifamily | 8 | $1,800,000 | $225K | March 2005 | Both sides |
| 4839 San Gordiano Ave | Multifamily | 4 | $1,300,000 | $325K | March 2005 | Both sides |
| 1815 State St | Office | — | $1,420,000 | — | October 2004 | Buyer |
| 1520 Bath St | Multifamily | 4 | $1,490,000 | $373K | September 2004 | Seller |
| 3908 State St | Office | — | $12,700,000 | — | May 2004 | Buyer |
| 701 W Bath St | Multifamily | 12 | $2,262,500 | $189K | April 2004 | Both sides |
| 401 W Los Olivos | Multifamily | 18 | $2,500,000 | $139K | January 2004 | Both sides |
| 320 E Victoria St | Multifamily | 4 | $1,150,000 | $288K | December 2003 | Seller |
| 401 W De La Guerra St | Land | — | $512,500 | — | December 2003 | Seller |
| 420 W Montecito St | Hospitality | 9 | $1,510,000 | $168K | December 2003 | Seller |
| 2314 De La Vina St | Multifamily | 6 | $1,264,000 | $211K | November 2003 | Seller |
| 603 Eucalyptus Ave | Multifamily | 17 | $2,325,000 | $137K | October 2003 | Buyer |
| 900 N Milpas St | Retail | — | $525,000 | — | September 2003 | Both sides |
| 608 Santa Barbara St | Multifamily | 9 | $1,600,000 | $178K | September 2003 | Buyer |
| 1624 Bath St | Multifamily | 3 | $1,150,000 | $383K | August 2003 | Seller |
| 1020 Olive St | Multifamily | 3 | $1,000,000 | $333K | May 2003 | Seller |
| 412 -414 W Sola St B | Multifamily | 3 | $935,000 | $312K | May 2003 | Seller |
| 318 W Valerio | Multifamily | 22 | $2,850,000 | $130K | May 2003 | Both sides |
| 201 Bath St | Multifamily | 12 | $2,085,000 | $174K | April 2003 | Seller |
| 1810 Chapala St | Multifamily | 12 | $2,500,000 | $208K | April 2003 | Buyer |
| 1125 De La Vina St | Multifamily | 9 | $1,425,000 | $158K | March 2003 | Seller |
| 1510 Garden St | Multifamily | 16 | $2,953,000 | $185K | February 2003 | Both sides |
| 2431 Castillo St | Office | — | $995,000 | — | January 2003 | Seller |
| 28 W Pedregosa St | Multifamily | 14 | $2,150,000 | $154K | January 2003 | Buyer |
These are the Golis Team's own closings, grouped by each property's mailing city, not a record of every sale in Santa Barbara. Mailing cities don't always follow city limits, so an address here can sit just outside the City of Santa Barbara. How we count.
Apartment buildings we've sold, by size
- 2–4 units45
- 5–19 units75
- 20–49 units12
- 50+ units3
Median building size: 7 units.
Who we represented
- Represented the seller95
- Represented the buyer48
- Represented both sides50
Multifamily 139 · Office 23 · Land 13 · Retail 7 · Hospitality 5 · Industrial 5 · Commercial 1
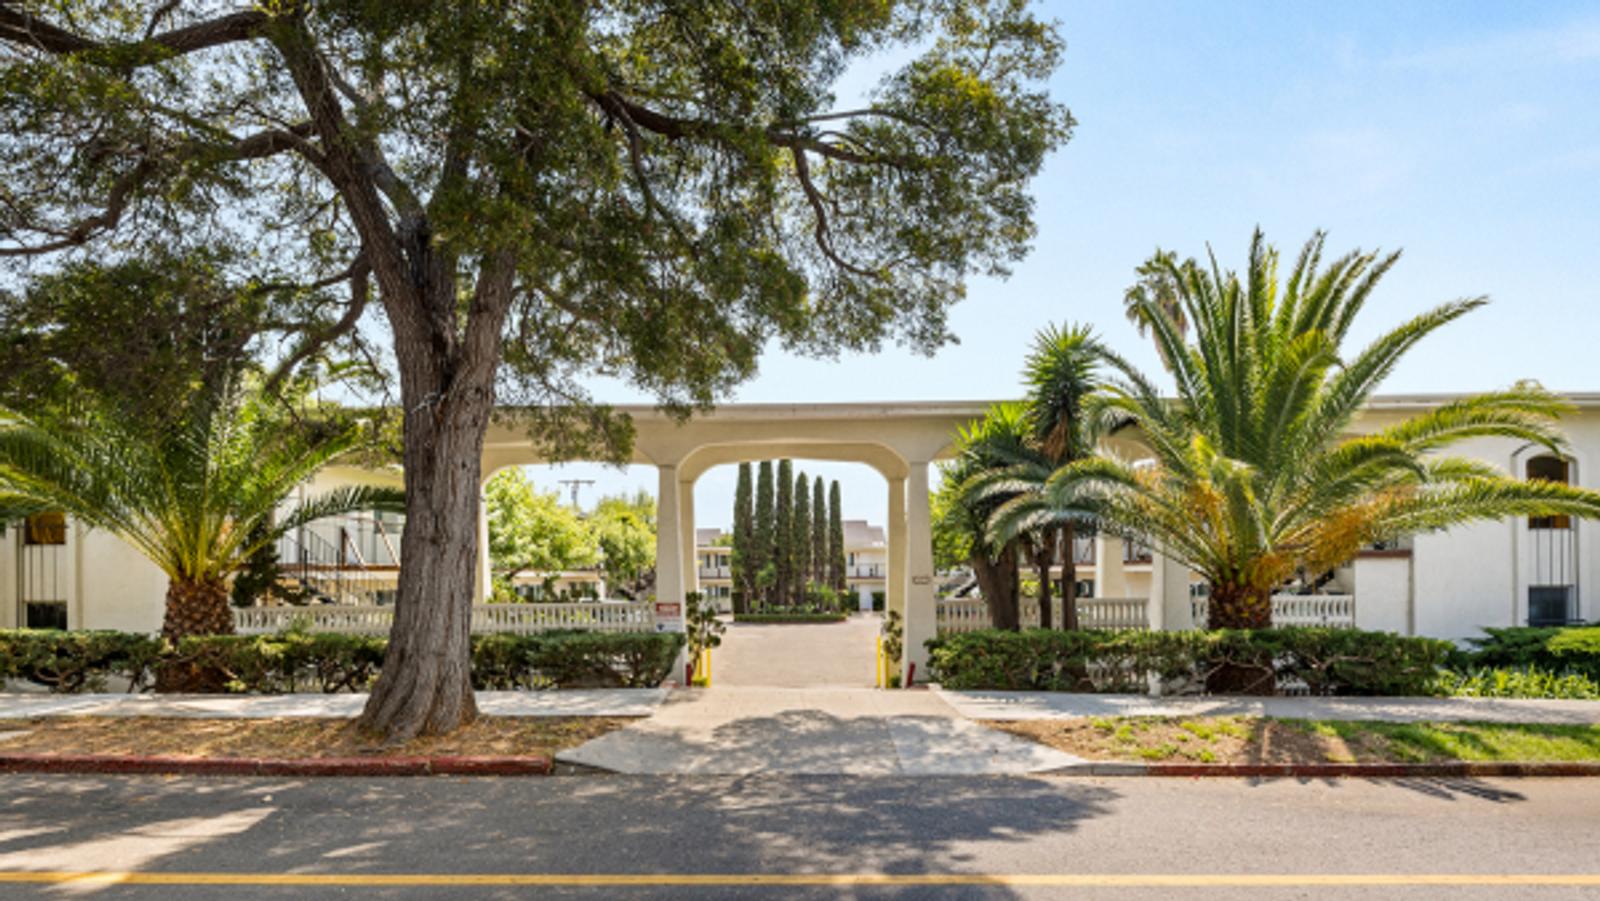
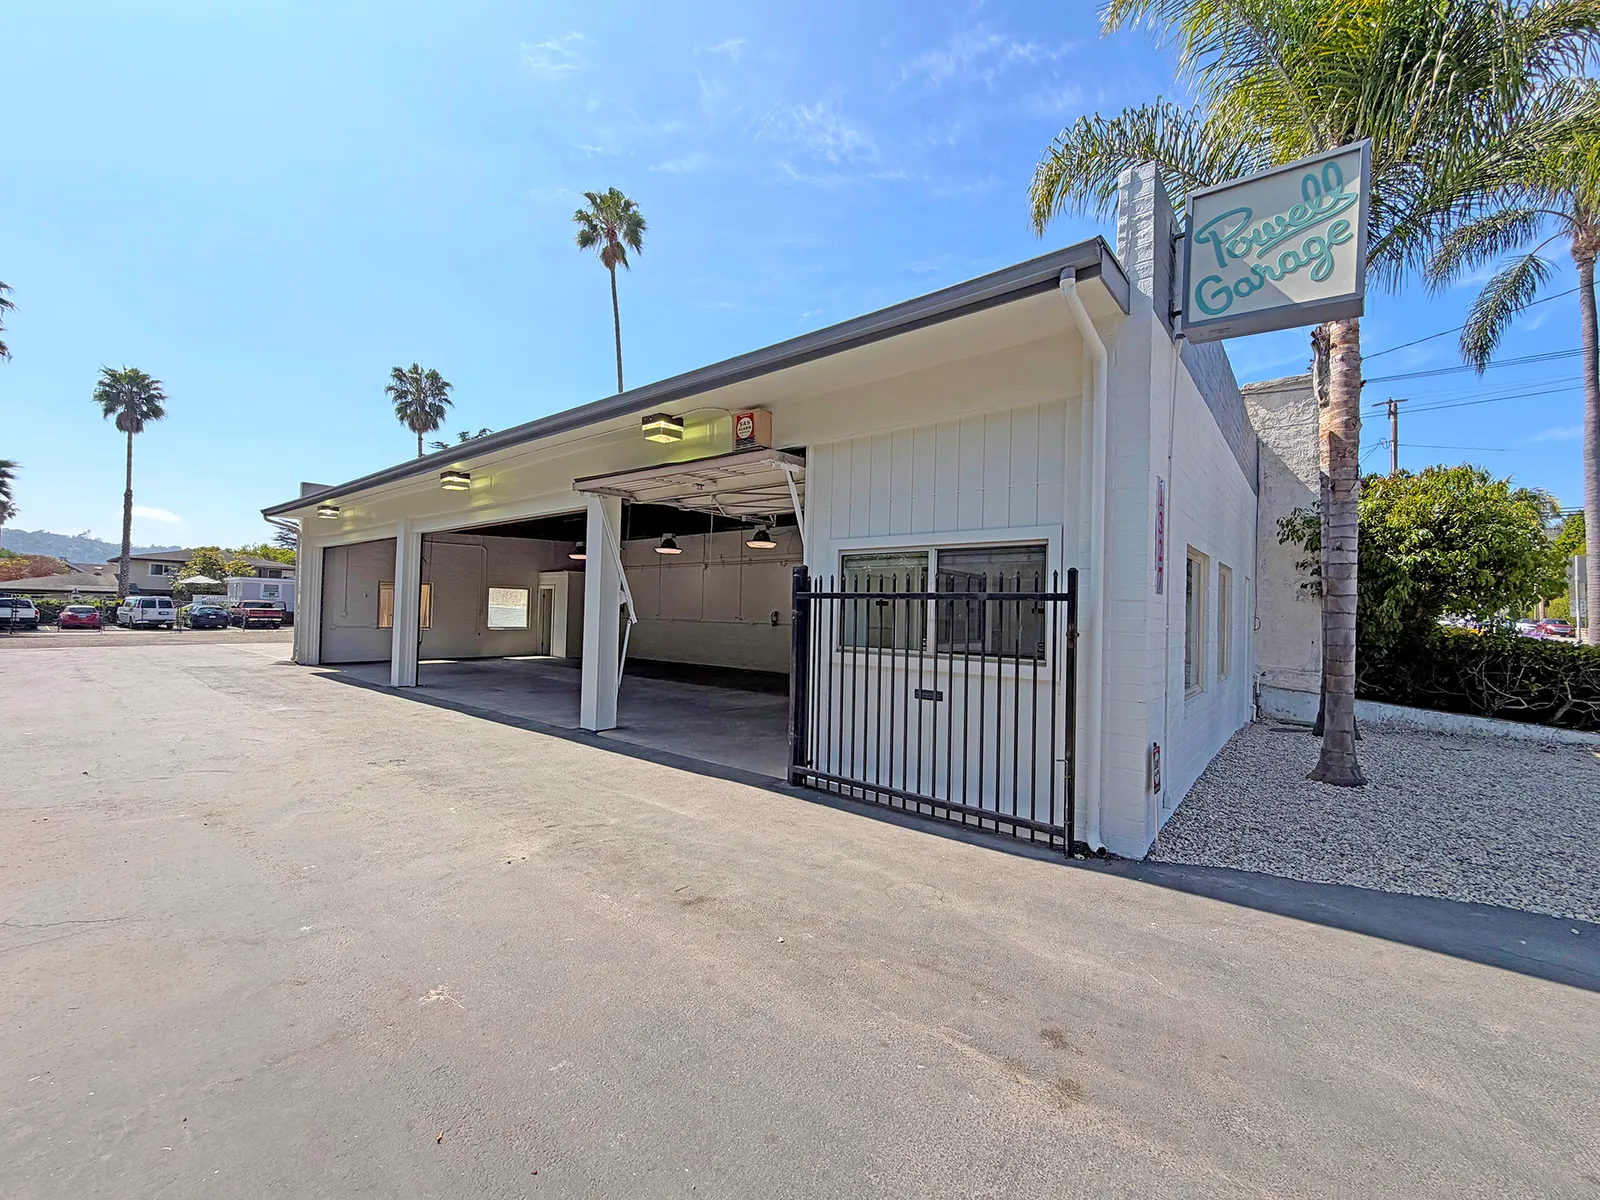
Available Now
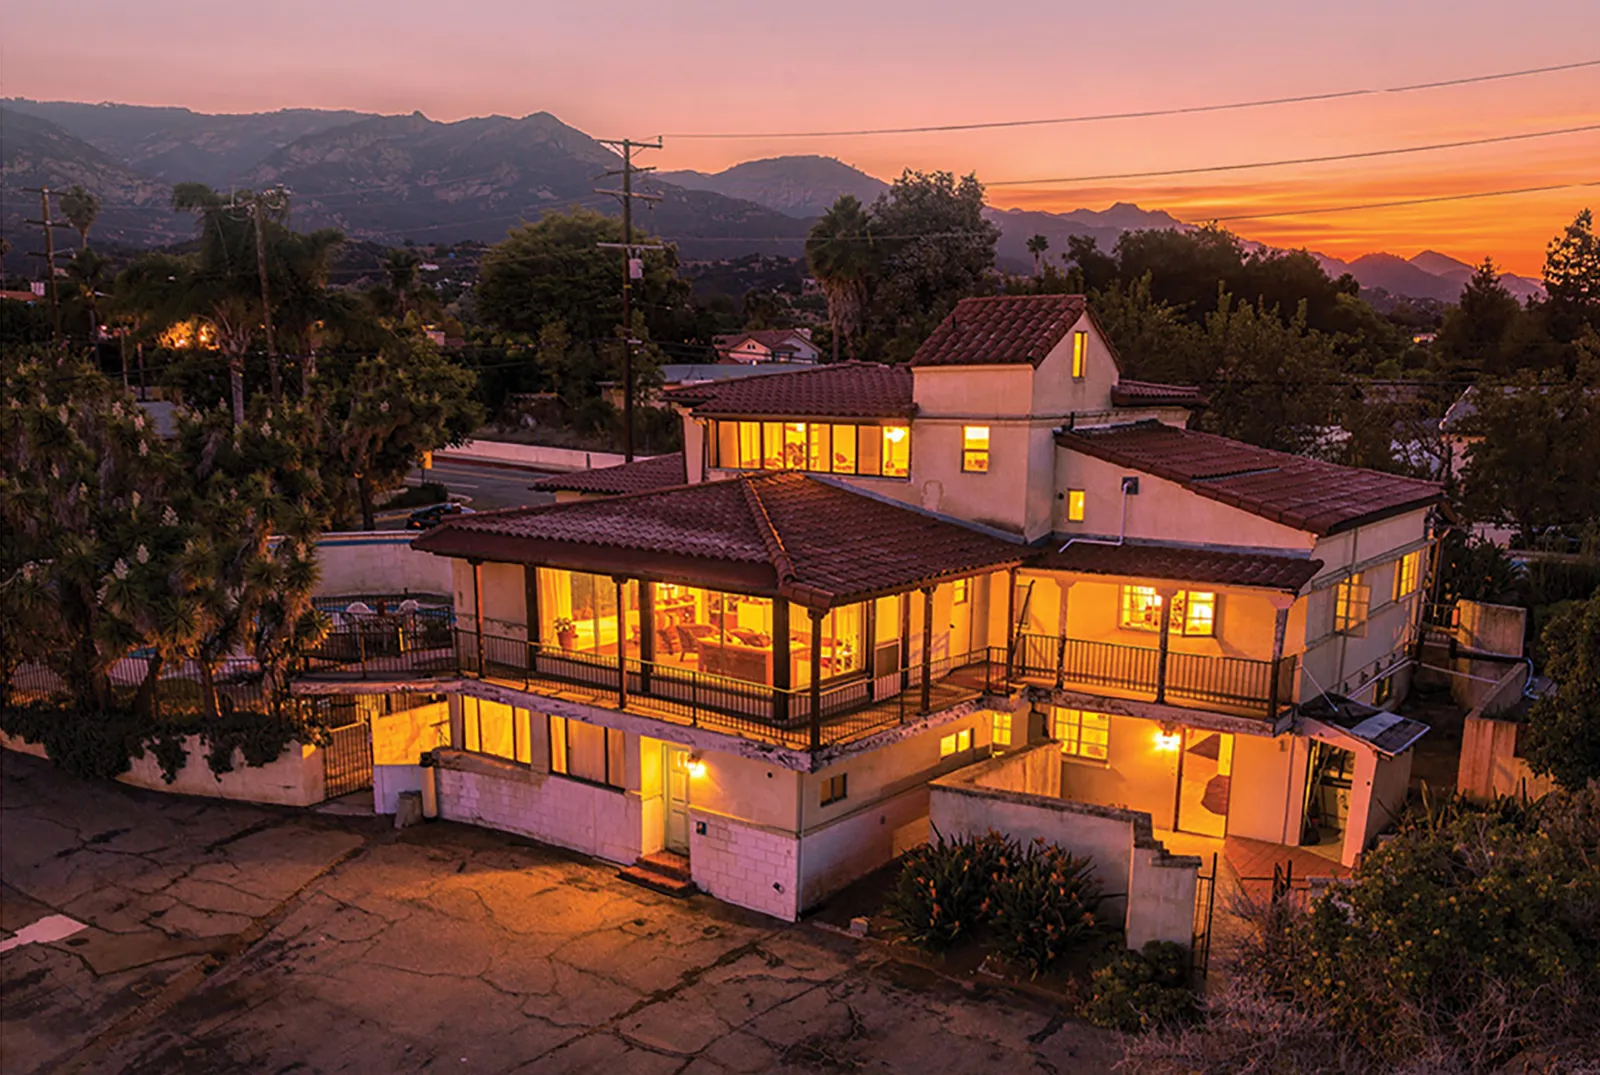
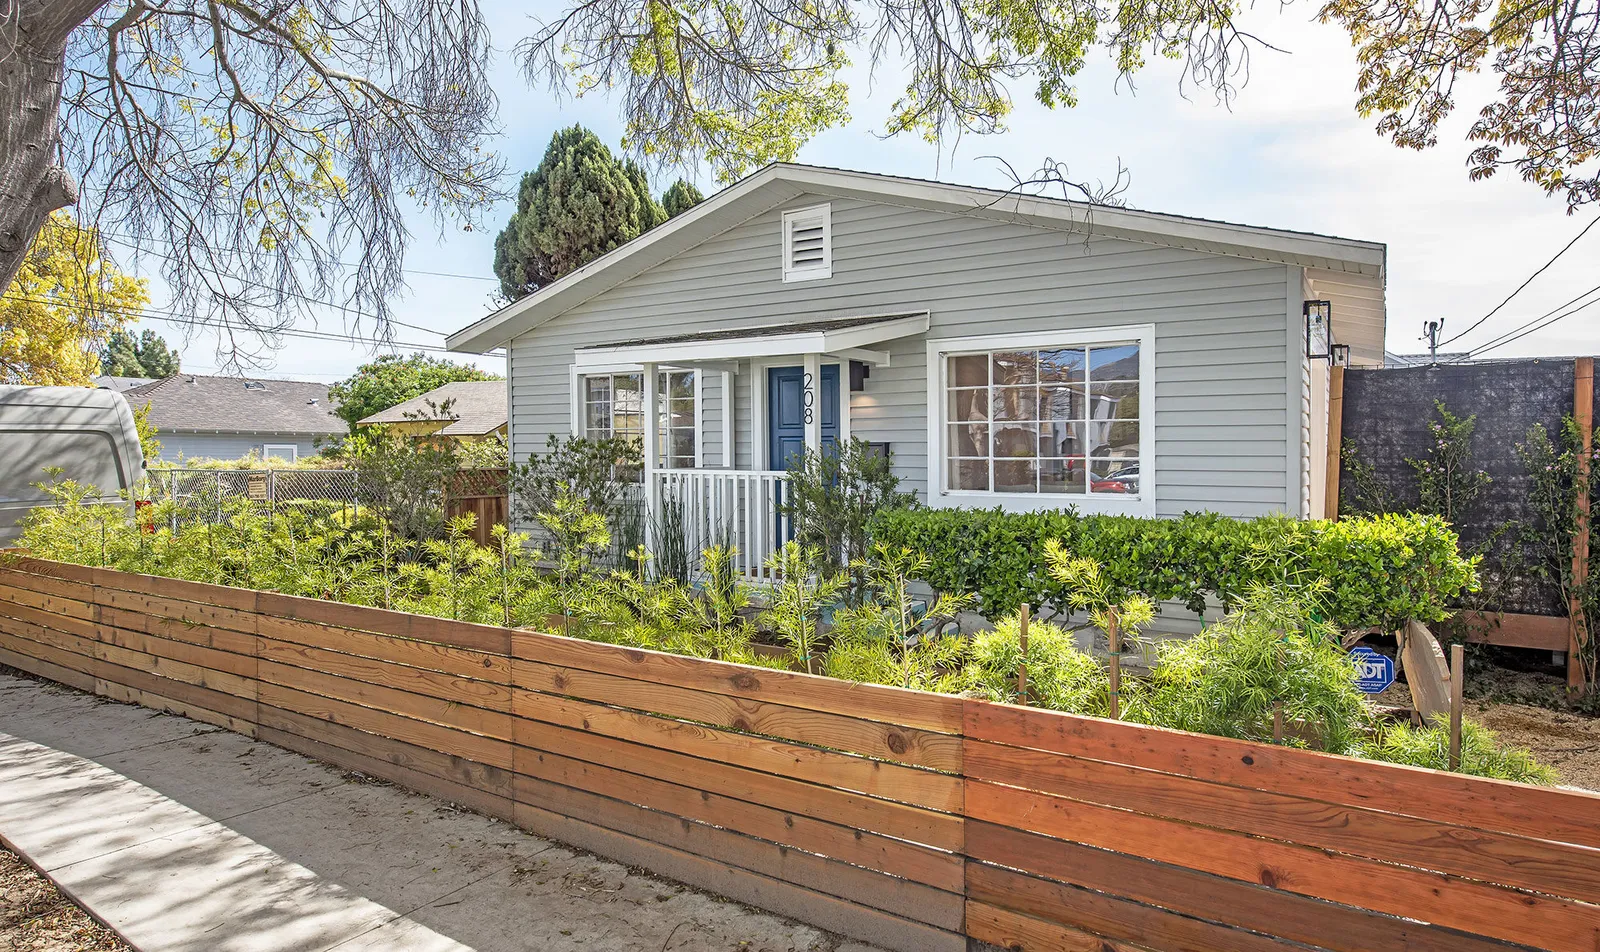
For sale in Santa Barbara.
Rent Rules
Does Santa Barbara have rent control?
Yes. The City Council gave final approval to rent stabilization on October 6, 2026.
- The ordinance adds Chapters 26.90 (rent stabilization) and 26.100 (rental registry) to the Municipal Code and takes effect November 5, 2026, unless a referendum petition is filed first. Signature gathering is under way.
- It covers most rental units with a certificate of occupancy issued before February 1, 1995. Single-family homes and condominiums are generally exempt under state law.
- From January 1, 2027, the yearly increase on covered units is 60% of the change in California CPI, never more than 3% and never below zero (about 2.1% for 2027). A temporary rent freeze holds covered rents at December 16, 2025 levels through December 31, 2026.
- Owners can still set a new tenant's starting rent when a unit is lawfully vacated. Nearly every rental unit must register with the City, starting with covered units by April 1, 2027.
Sources
City of Santa Barbara rules as summarized on October 17, 2026. A summary, not legal advice: rules change, and exemptions turn on the details of a property and tenancy. Confirm with the City of Santa Barbara or an attorney before acting.
The Wider Market
Santa Barbara sits in our Santa Barbara South County report.
What draws buyers to Santa Barbara South County
- Supply is effectively capped — coastline, mountains, and slow-growth politics make new product rare and protect in-place assets.
- A deep, affluent renter base (UCSB, tech, healthcare, second-home demand) keeps quality units leased through every cycle.
- An irreplaceable coastal location commands a permanent rent premium and the region’s most durable values.
What gives Santa Barbara South County buyers pause
- Sub-5% cap rates — you pay up for the zip code, and current yields are thin.
- The City's rent stabilization ordinance caps yearly increases on most pre-1995 units at 60% of CPI, never more than 3%, from January 2027, limiting rent upside.
- High entry prices plus rising insurance and property taxes squeeze cash flow.
These points, like the market figures at the top of the page, describe the whole Santa Barbara South County submarket, not Santa Barbara alone.
Research
Reading for Santa Barbara owners.
Santa Barbara City Council Gives Final Approval to Rent Control, 4–3
Santa Barbara's City Council gave final approval to rent control, 4–3, on Oct. 6. What one of California's most restrictive ordinances means for owners.
Santa Barbara Rent Control: What Multifamily Owners Need to Know
How Santa Barbara rent control works: which pre-1995 units are covered, the 2.1 percent cap for 2027, petitions, the registry and what to do now.
The Sixty Percent Experiment: Santa Barbara's New Rent Math — and the Free Calculator That Puts "Fair Return" to the Test
California rent control stands on a right almost nobody can compute — the fair return. Santa Barbara published its formula, so we built the free calculator that runs it, and documented how the strictest rent math in the state got written.
Frequently Asked
Santa Barbara,
answered.
Short answers to what Santa Barbara owners and buyers ask us, from our own closings and the current rules.
How many properties has the Golis Team sold in Santa Barbara?
Since 2003, we have closed 193 transactions in Santa Barbara, totaling 1,617 units. The most recent closed in October 2026.
What do apartment buildings sell for in Santa Barbara?
Santa Barbara is part of the Santa Barbara South County submarket, where apartment buildings averaged $425,624 per door at a 4.93% average cap rate across 20 sales in 2025 (Radius proprietary research). Our most recent apartment sale there was 1011 Laguna St, 8 units, at $2,500,000 in October 2026. A broker opinion of value prices a specific building against current comparables.
Does Santa Barbara have rent control?
Yes. The City Council gave final approval to rent stabilization on October 6, 2026. The ordinance adds Chapters 26.90 (rent stabilization) and 26.100 (rental registry) to the Municipal Code and takes effect November 5, 2026, unless a referendum petition is filed first. Signature gathering is under way. (Summary as of October 17, 2026; not legal advice.)
Which market report covers Santa Barbara?
Santa Barbara is part of our Santa Barbara South County report, which has the submarket's 2025 cap rate, price per door and volume, its Q4 2025 vacancy, and our commentary on where the market is heading.
Can I get a confidential valuation of my Santa Barbara apartment building?
Yes. A broker opinion of value from the Golis Team is free and confidential, with no obligation to list. It is built on our own closed sales and current rents. Request one at https://www.centralcoastmultifamily.com/apartment-building-valuation or call 805-728-5561.
Own an apartment building in Santa Barbara?
A broker opinion of value is free and confidential, with no obligation to list. We price it against our own closings and current rents, and walk you through the number.