

Ventura County · Multifamily brokerage
Oxnard apartment building sales
Oxnard is the largest city in Ventura County. It also has its own apartment rent cap, which matters to anyone underwriting an older building there.
Since 2003 we have closed 8 transactions in Oxnard, totaling 162 units. The most recent closed in September 2022.
Market figures are the Ventura County submarket's, which includes Oxnard: Radius proprietary research, calendar year 2025, vacancy as of Q4 2025. Our closings and listings are the Golis Team's own in Oxnard.
Track Record
What we've sold in Oxnard.
430-440 W Linden Dr
Oxnard · 8 Units · Multifamily
$2,200,000 · September 2022
300 N G Street
Oxnard · 20 Units · Multifamily
$3,700,000 · May 2020
5001 C Street
Oxnard · 32 Units · Multifamily
$6,100,000 · January 2018
1400 Edgewood Way
Oxnard · 22 Units · Multifamily
$3,100,000 · September 2017
5034 Nautilus St
Oxnard · 20 Units · Multifamily
$3,385,000 · July 2007
5034 Nautilus St
Oxnard · 20 Units · Multifamily
$2,600,000 · June 2003
All 8 of our Oxnard closingsShow the list
| Property | Type | Units | Price | Per unit | Closed | We represented |
|---|---|---|---|---|---|---|
| 430-440 W Linden Dr | Multifamily | 8 | $2,200,000 | $275K | September 2022 | Buyer |
| 300 N G Street | Multifamily | 20 | $3,700,000 | $185K | May 2020 | Seller |
| 5001 C Street | Multifamily | 32 | $6,100,000 | $191K | January 2018 | Both sides |
| 1400 Edgewood Way | Multifamily | 22 | $3,100,000 | $141K | September 2017 | Seller |
| 5034 Nautilus St | Multifamily | 20 | $3,385,000 | $169K | July 2007 | Seller |
| 5009 Nautilus St | Multifamily | 20 | $3,030,000 | $152K | December 2004 | Buyer |
| 5009 Nautilus St | Multifamily | 20 | $2,600,000 | $130K | June 2003 | Buyer |
| 5034 Nautilus St | Multifamily | 20 | $2,600,000 | $130K | June 2003 | Buyer |
These are the Golis Team's own closings, grouped by each property's mailing city, not a record of every sale in Oxnard. Mailing cities don't always follow city limits, so an address here can sit just outside the City of Oxnard. How we count.
Apartment buildings we've sold, by size
- 2–4 units0
- 5–19 units1
- 20–49 units7
- 50+ units0
Median building size: 20 units.
Who we represented
- Represented the seller3
- Represented the buyer4
- Represented both sides1
Multifamily 8
Available Now
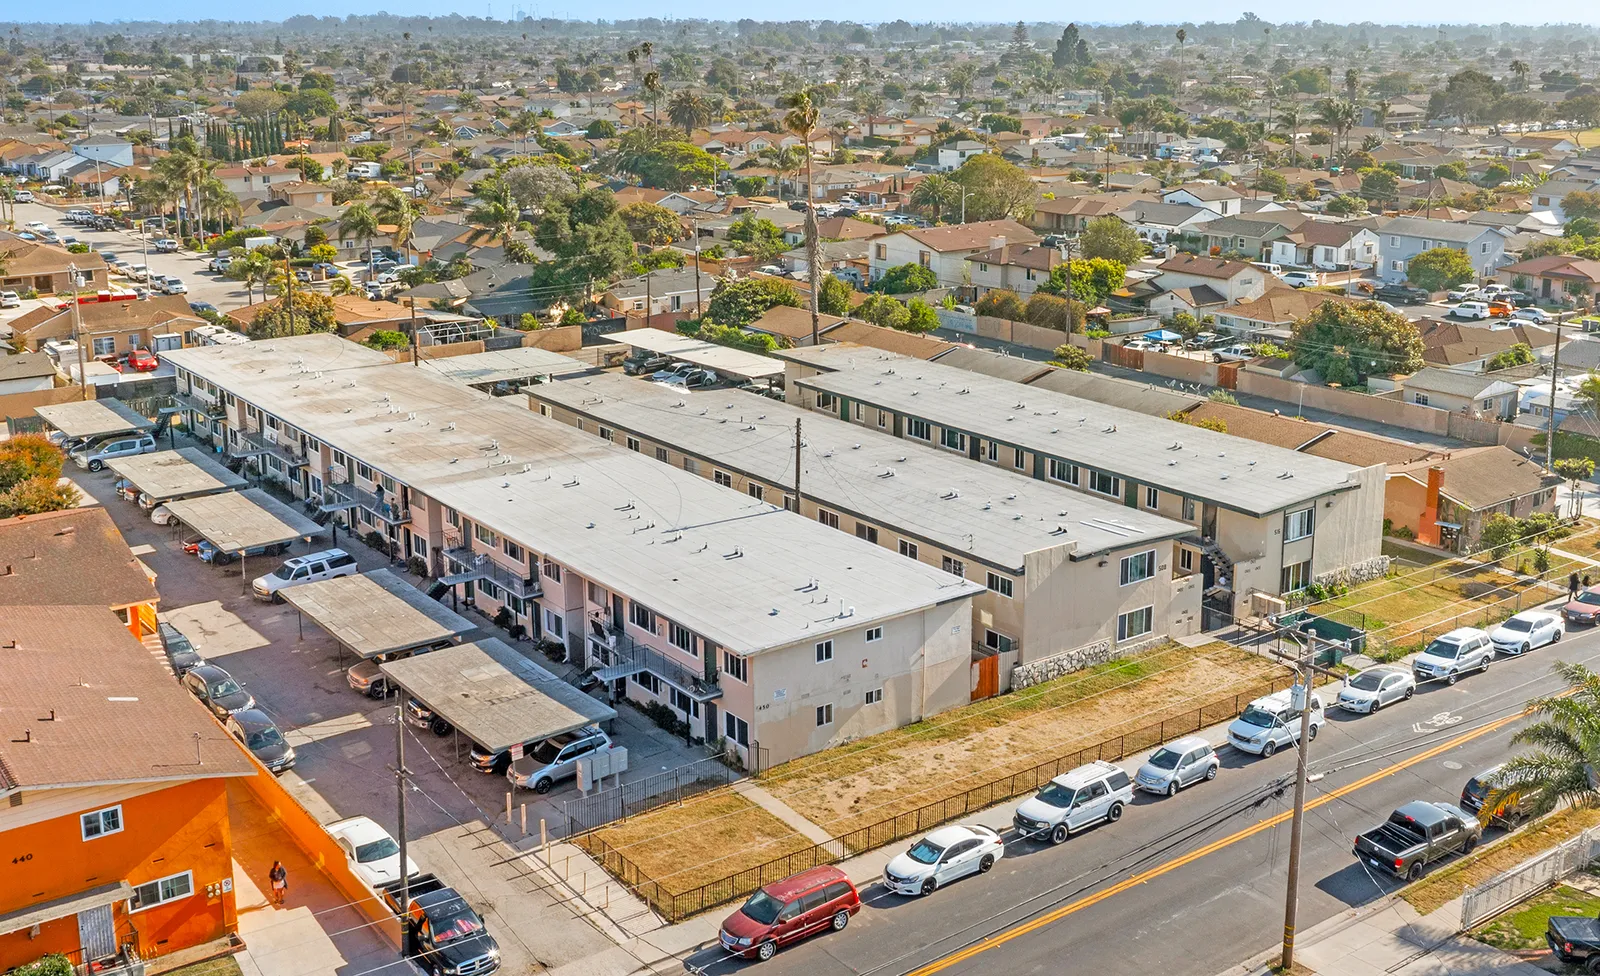
For sale in Oxnard.
Rent Rules
Does Oxnard have rent control?
Yes. Oxnard caps increases at 4% a year for buildings from February 1, 1995 or earlier.
- For properties built on or before February 1, 1995, the City limits rent increases to 4% a year, with one increase in any twelve-month period. When a tenant moves out, the asking rent can be set by the market.
- Owners may petition for relief if the cap prevents a fair and reasonable return. A separate just cause ordinance covers the newer rentals that the cap does not.
- Every residential rental must be registered with the City each year. A June 15, 2026 draft fee study proposes annual program fees of $140 per fully covered unit and $70 per partially covered unit.
Sources
City of Oxnard rules as summarized on October 12, 2026. A summary, not legal advice: rules change, and exemptions turn on the details of a property and tenancy. Confirm with the City of Oxnard or an attorney before acting.
The Wider Market
Oxnard sits in our Ventura County report.
What draws buyers to Ventura County
- The deepest inventory and most liquidity on our coverage map — more deals, easier exits.
- Higher yields than Santa Barbara with the same coastal-California fundamentals.
- Demand from LA-adjacent jobs plus local agriculture, the Port of Hueneme, and naval employment.
What gives Ventura County buyers pause
- A patchwork of city jurisdictions and rent rules adds regulatory complexity.
- Building age, rents and the rent rule that applies vary block to block (e.g., north vs. south Oxnard).
- Higher vacancy in pockets and more competition from LA-basin product.
These points, like the market figures at the top of the page, describe the whole Ventura County submarket, not Oxnard alone.
Research
Reading for Oxnard owners.
Oxnard Multifamily: North vs. South, and Why Building Age Matters
In Oxnard, building age sets the rent cap: 4 percent for buildings certified by Feb. 1, 1995, state law after. Sales data, Census rents and 2026 rules.
AB 1482 in Plain English: Statewide Rent Caps and Just-Cause
The AB 1482 rent cap is 8.6% in Santa Barbara, Ventura and SLO counties through July 2027: the math, exemptions, just cause and stricter local rules.
How to Read a Rent Roll: A Buyer's Checklist
What a complete rent roll shows, how to tie it to the T-12 and bank deposits, and the California and Santa Barbara rules that decide what it's worth.
Frequently Asked
Oxnard,
answered.
Short answers to what Oxnard owners and buyers ask us, from our own closings and the current rules.
How many properties has the Golis Team sold in Oxnard?
Since 2003, we have closed 8 transactions in Oxnard, totaling 162 units. The most recent closed in September 2022.
What do apartment buildings sell for in Oxnard?
Oxnard is part of the Ventura County submarket, where apartment buildings averaged $270,890 per door at a 5.03% average cap rate across 29 sales in 2025 (Radius proprietary research). Our most recent apartment sale there was 430-440 W Linden Dr, 8 units, at $2,200,000 in September 2022. A broker opinion of value prices a specific building against current comparables.
Does Oxnard have rent control?
Yes. Oxnard caps increases at 4% a year for buildings from February 1, 1995 or earlier. For properties built on or before February 1, 1995, the City limits rent increases to 4% a year, with one increase in any twelve-month period. When a tenant moves out, the asking rent can be set by the market. (Summary as of October 12, 2026; not legal advice.)
Which market report covers Oxnard?
Oxnard is part of our Ventura County report, which has the submarket's 2025 cap rate, price per door and volume, its Q4 2025 vacancy, and our commentary on where the market is heading.
Can I get a confidential valuation of my Oxnard apartment building?
Yes. A broker opinion of value from the Golis Team is free and confidential, with no obligation to list. It is built on our own closed sales and current rents. Request one at https://www.centralcoastmultifamily.com/apartment-building-valuation or call 805-728-5561.
Own an apartment building in Oxnard?
A broker opinion of value is free and confidential, with no obligation to list. We price it against our own closings and current rents, and walk you through the number.