

Central Coast Multifamily: Q2 2026 Market Report
Q2 2026 Central Coast multifamily: nine 5+ unit sales for $31.7 million, the slowest quarter in years, plus 20 South County 2–4 unit sales.
From the multifamily sections (5+ units and 2–4 units) of the Radius Commercial Real Estate Q2 2026 Quarterly CRE Market Report, as published on radiusgroup.com.
Multifamily Investments: 5+ Units
Contribution by Jack Gilbert DRE #02197493
A Market in Transition
Q2 Central Coast Multifamily Market Overview
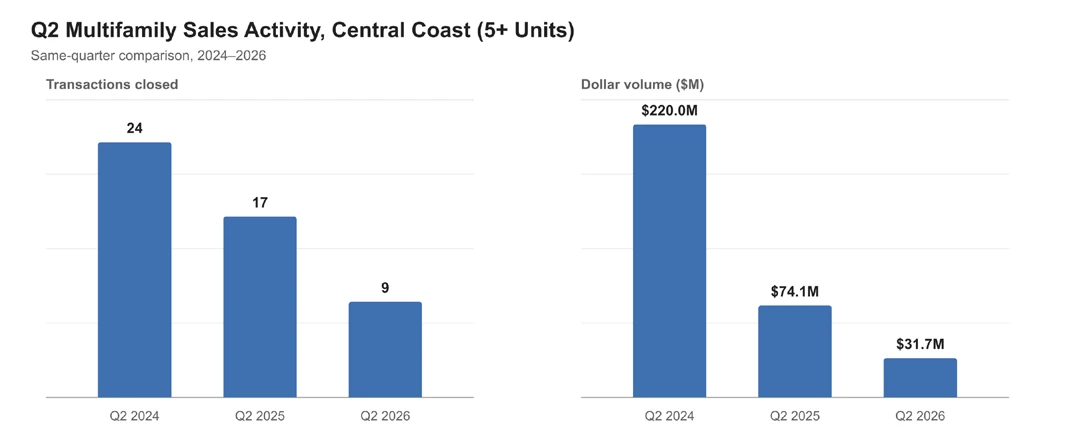
The second quarter of 2026 recorded nine transactions of 5+ unit multifamily properties across the Central Coast, totaling $31,730,000 in sales volume and 80 units — the quietest quarter in recent years. The same period produced 17 transactions and $74.1 million in 2025, and 24 transactions and $220.0 million in 2024. After a deceptively strong first quarter ($307.0 million, roughly 81% of it from three institutional trades), Q2 shows what the market looks like when only private capital is transacting: smaller deals, longer marketing periods, and hard-fought pricing.
Three forces defined the quarter: a 10-year Treasury that ground higher and never gave the move back; institutional capital fully on the sidelines, with the largest closing at just $5.85 million; and the City of Santa Barbara moving from debating rent control to finalizing it, with the permanent ordinance published in draft on June 10 and set for adoption July 28. Yet the thin closing tape overstates how quiet the quarter was. Listing activity accelerated meaningfully — most visibly in Ventura County — and the deals marketed in Q2 will show up as Q3 closings.
- 9 Transactions: Fewest quarterly multifamily sales on the Central Coast in recent years
- $31.7 Million Total Q2 Sales Volume: Down 57% from Q2 2025 and 86% from Q2 2024
- 0 Institutional Buyers: Every Q2 sale was acquired by private capital
Interest Rates: The 10-Year Grinds Higher
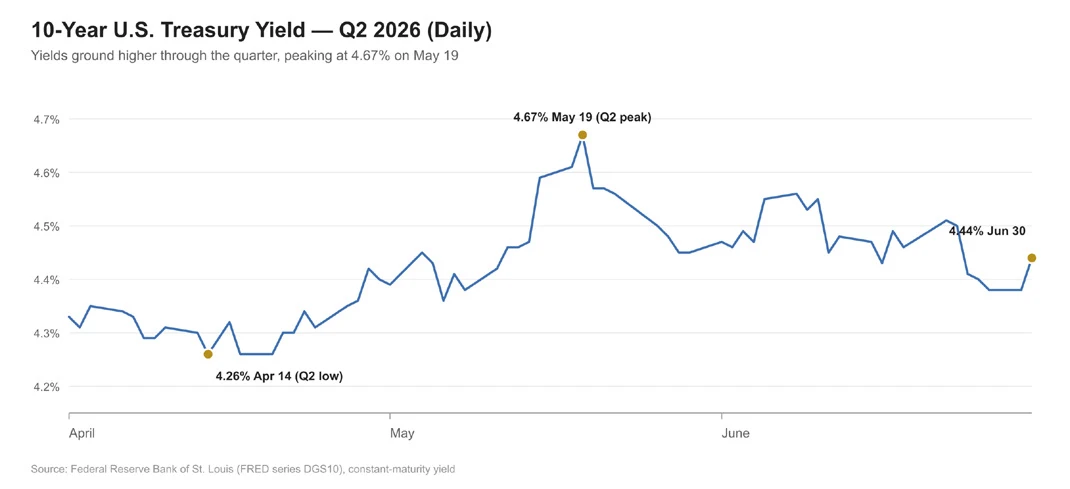
The 10-year Treasury opened the quarter at 4.33%, touched its Q2 low of 4.26% in mid-April, climbed roughly 40 basis points to a peak of 4.67% on May 19, and closed at 4.44% — averaging about 4.42%, some 20 basis points above the first quarter. Early Q3 has offered no relief: yields moved back above 4.60% in mid-July.
The math this creates is unforgiving. With the 10-year in the mid-4s, all-in debt costs generally price near or above 6% while quality coastal product still trades at cap rates in the high-4s to high-5s — negative or, at best, neutral leverage. Levered buyers can’t stretch, all-cash and 1031 exchange buyers set the market, and sellers who don’t need to transact simply wait. Until borrowing costs and going-in yields normalize, volume is likely to stay well below the 2021–2024 run rate.
The Institutional Freeze
Not a single institutional buyer closed on the Central Coast in Q2. The nine trades ranged from $900,000 to $5.85 million, with a median of $3.7 million — every buyer a private individual, trust, or small partnership. The contrast with Q1 is stark: Hines’ $105 million Oxnard acquisition, the $75 million Hancock Terrace purchase in Santa Maria, and Jackson Square’s $69.5 million Camarillo deal totaled $249.5 million of institutional volume — followed by zero. Some of that is lumpiness, as institutional-scale product rarely trades here. But with negative leverage, decelerating rent growth, and regulatory uncertainty in the region’s highest-profile city, large allocators have little reason to chase thin going-in yields. Institutions can afford to wait; this quarter’s private sellers — estates, long-time owners, exchange buyers — often could not.
Santa Barbara South County | 5+ Units
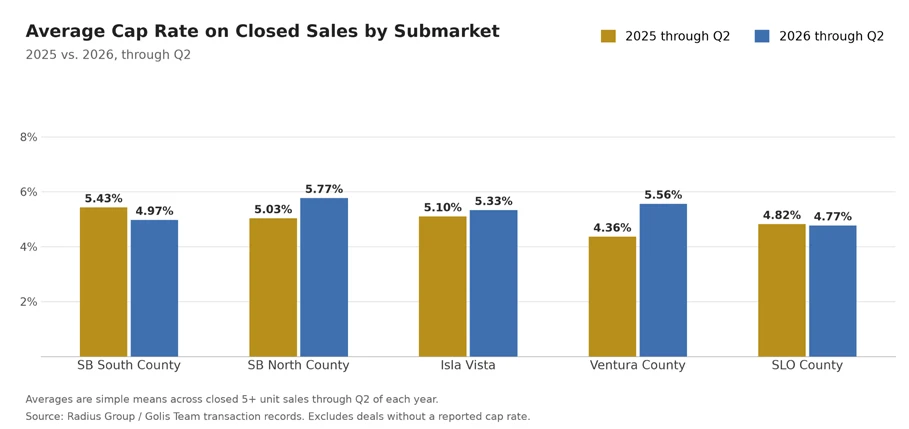
South County recorded four closings totaling $17,980,000 and 33 units — a count that includes the quarter’s single Isla Vista sale, consistent with how we traditionally report the broader South Coast — matching Q1 on the same basis, and down from six a year ago. Average pricing of $467,277 per unit was the region’s highest, at an average 5.32% cap rate on conventional trades. The composition tells the real story: capital gravitated toward assets with limited exposure to the coming ordinance.
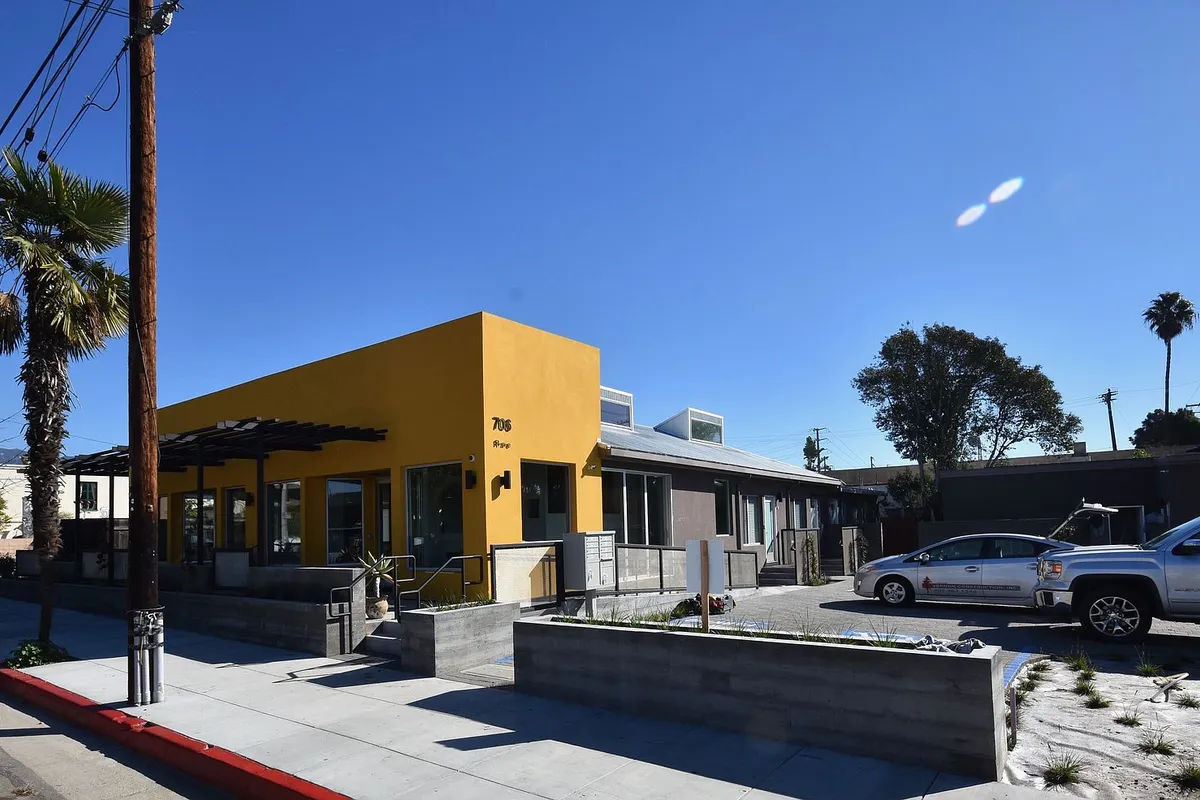
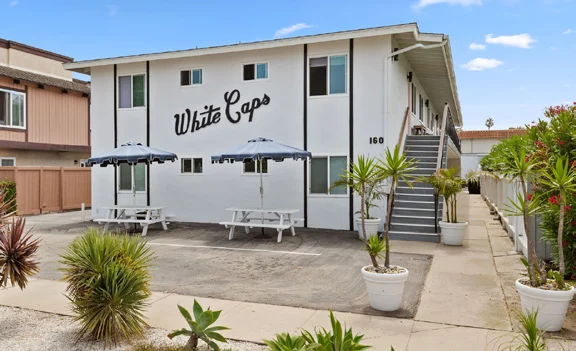
706-708 E. Haley Street, a 2016-built mixed-use property (five apartments over three commercial spaces), sold for $3,305,000 — within 1% of list — with its post-1995 RSO exemption featured prominently in the marketing. 160 Ash Avenue in Carpinteria, seven units operated on blended short-term/conventional rents, achieved the quarter’s highest South County per-unit price at $692,857 ($4,850,000) — outside city limits and outside the ordinance entirely. The one squarely covered asset, the 16-unit two-building portfolio at 3445 & 3449 Richland Drive, closed at $5,850,000 — a full 10% below list and at the widest cap rate of the three, 5.50%. One quarter is a small sample, but the pattern matches what we see in buyer behavior every week: ordinance exposure is now being priced explicitly.
Rent Control: Where Things Stand
Q2 was the quarter rent control went from concept to countdown. The temporary freeze (Ordinance 2026-6206) held rents on covered units at their December 16, 2025 levels throughout the quarter, and on June 10 the City published the public-review draft of the permanent Rent Stabilization Ordinance (SBMC Ch. 26.90). Key provisions:
- Annual increases capped at the lesser of 60% of CPI or 3% (0% floor, no banking) — roughly one-third of the statewide AB 1482 standard in a typical year.
- Coverage of ~13,000 units, generally those with a certificate of occupancy before February 1, 1995. Post-1995 construction, single-family homes and condos, owner-occupied duplexes, and deed-restricted units are exempt.
- A mandatory owner-funded rental registry (~$2 million/year), a rent board, and petition processes for fair-return adjustments and capital-improvement pass-throughs.
- Timeline: public comment closed July 10; formal adoption is scheduled for July 28, 2026; the program becomes operative January 1, 2027.
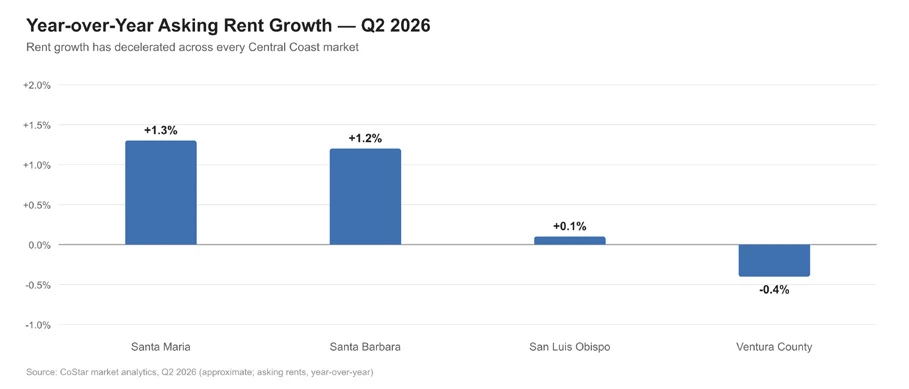
The practical effects were already visible in Q2: wider bid-ask spreads on covered assets, lower rent-growth assumptions inside city limits, and a clear premium for exempt product, vacant units, and assets outside city jurisdiction — Goleta, Carpinteria, and the unincorporated county remain under state law only. CoStar shows asking rent growth decelerating to roughly +1.2% year-over-year; with in-place rents frozen, revenue growth on covered assets is effectively zero until the program’s first allowable increase. The July 28 hearing should finally give underwriting the clarity it has lacked for the past year.
Rent Control: What to Expect
- Surrounding markets heating up: Listing activity in the ordinance-exempt markets accelerated sharply, with just one 5+ unit property coming to market in Q1 2026 versus five in Q2 — and two more added in the first half of July. Goleta is the standout: prior to the RSO discussions, the city went two and a half years without a single 5+ unit multifamily sale; it now has three properties on the market and one in escrow.
- Buyer hesitation: Even after the July 28 hearing brings clarity, expect a brief adjustment period marked by volatility in perceived market value — manifesting in expanded cap rates and an increased emphasis on vacancy in underwriting.
- Sellers exiting, not optimizing: Expect the seller pool to continue skewing toward long-time owners exiting the regulatory burden rather than investors optimizing a return.
Isla Vista
Isla Vista recorded one transaction (included in the South County totals above): 6597 Trigo Road, a 10-unit, all-one-bedroom student housing property built in 1970, sold April 24 for $3,975,000 ($397,500/unit) at a 5.66% cap rate — fully leased for 2025–26 and about 3% below list after an earlier price reduction. Isla Vista sits in the unincorporated county and is not subject to the city’s ordinance; AB 1482 governs. The longer-term picture is unchanged: UCSB enrollment underpins durable demand, but the university’s San Benito on-campus housing project is a genuine headwind for the smallest floor plans. An all-one-bedroom building competes most directly with dormitory-style product — a dynamic reflected in a mid-5s cap rate that would have been unthinkable for IV student housing three years ago.
Santa Barbara North County | 5+ Units
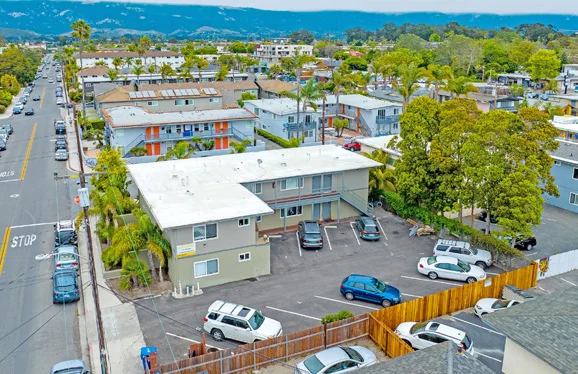
North County saw a single trade: 223 E. Tunnell Street in Santa Maria, seven 1940s casitas arranged around a courtyard, sold June 23 for $1,250,000 — 23% below its $1,625,000 list — at a 7.91% cap rate, the highest disclosed on any Central Coast trade so far in 2026. Pricing power has clearly shifted toward buyers at the value end of the market. Context matters: Santa Maria is digesting a wave of new supply, with CoStar overall vacancy near 9% (stabilized ~4.3%) as recent deliveries lease up. The Hancock Terrace affordable conversion from Q1 should gradually pull 200+ units out of the market-rate pool, and asking rents are stabilizing — up roughly 1.3% year-over-year after steep 2025 declines, the region’s strongest print, albeit off a lowered base.
Ventura County | 5+ Units
Ventura County closed two trades totaling $7.9 million and 28 units, down from five transactions and $43.3 million in Q2 2025. 706-720 W. 5th Street in Oxnard, an 18-unit 1954-vintage property, sold for $4,480,000 ($248,889/unit) at a 4.90% cap rate; 293-295 W. Park Row Avenue in Ventura, 10 units in a two- and three-bedroom mix, closed at $3,420,000 ($342,000/unit) and a 5.60% cap.
But the closing count is a misleading measure of the quarter. Q2 in Ventura County was a conversion period, not a contraction: twelve 5+ unit listings were active at quarter-end, eight of which hit the market during Q2, and three were already reported in escrow. The true level of Q2 activity will be visible in Q3’s closing tape, and we expect the county’s transaction count to rebound meaningfully. Rents are the soft spot — the county posted the Central Coast’s only negative print at roughly -0.4% year-over-year — and South Oxnard operators continue to report elevated turnover, adding carrying cost just as rent growth has stalled.
San Luis Obispo County | 5+ Units
SLO County recorded two closings for $4.6 million and 12 units, down from five a year ago. 175 Stimson Avenue in Pismo Beach, a seven-unit 1983 property, sold for $3,700,000 — $528,571 per unit, the quarter’s highest anywhere on the Central Coast — at a 5.98% cap rate, down from a $4,275,000 list. 2580 Main Street in Cambria, five units on two creek-side parcels, was an as-is estate sale at $900,000 ($180,000/unit) with rents well under market. The notable shift is rents: after leading the region at 2%+ annually through 2025, SLO asking rent growth flattened to roughly zero in early 2026. Cal Poly keeps the demand floor firm, and near-6 caps on coastal product like Stimson Avenue should keep exchange capital coming through the balance of the year.
Q2 2026 Summary & Outlook
Nine transactions, $31.7 million, 80 units: Q2 2026 goes into the books as the Central Coast’s slowest quarter in years, and the causes are not mysterious — debt costs above going-in yields, institutional capital that placed nearly $250 million in Q1 closing nothing, and the region’s most consequential regulatory event in decades reaching the doorstep of adoption. Beneath the headline, the market’s pulse is stronger than the closing count suggests: listing activity accelerated across the region, cap rates on closed deals averaged in the mid-5s (with prints from 4.79% to 7.91%), and sellers who met the market — often at meaningful discounts to list — got deals done.
What we are watching in Q3: the July 28 adoption hearing, which finally gives underwriters a fixed rulebook for city of Santa Barbara assets ahead of the January 1, 2027 start; the 10-year Treasury, which re-entered the 4.6s in July — sustained yields there would extend the volume drought, while a retreat toward 4% would unlock a real backlog of buyers and sellers; conversion of Ventura County’s escrow pipeline; and supply absorption in Santa Maria. The Central Coast’s fundamentals — chronically constrained supply, coastal premium, university and healthcare employment anchors — have not changed. The price of money and, in Santa Barbara, the rules of the game have. Owners weighing a sale should get current on both. As always, feel free to contact us for updated insights on market activity and the regulatory landscape.
Q2 2026 vs. Q2 2025, by Submarket
| SALES Q2 25 | SALES Q2 26 | UNITS Q2 25 | UNITS Q2 26 | VOLUME Q2 25 | VOLUME Q2 26 | CAP Q2 25 | CAP Q2 26 | |
|---|---|---|---|---|---|---|---|---|
| SB South County | 6 | 3 | 61 | 23 | $18,174,500 | $14,005,000 | 5.50% | 5.15% |
| Isla Vista | 0 | 1 | 0 | 10 | $0 | $3,975,000 | N/A | 5.66% |
| SB North County | 1 | 1 | 12 | 7 | $1,500,000 | $1,250,000 | 4.90% | 7.91% |
| Ventura County | 5 | 2 | 145 | 28 | $43,326,831 | $7,900,000 | 4.77% | 5.25% |
| SLO County | 5 | 2 | 54 | 12 | $11,120,000 | $4,600,000 | 4.69% | 5.98% |
| CENTRAL COAST TOTAL | 17 | 9 | 272 | 80 | $74,121,331 | $31,730,000 | — | — |
Cap rates are simple averages of disclosed rates on closed 5+ unit sales. SB South County figures include the Isla Vista sale, shown as a breakout row; cap-rate averages exclude the mixed-use 706-708 E Haley St sale.
All Q2 2026 closed transactions (5+ units)
| CITY | CLOSED | UNITS | SALE PRICE | PRICE/UNIT | CAP RATE | NOTES | |
|---|---|---|---|---|---|---|---|
| 706-708 E Haley St* | Santa Barbara | 4/27/26 | 8* | $3,305,000 | $413,125 | 5.37%* | Mixed-use, RSO-exempt |
| 3445 & 3449 Richland Dr | Santa Barbara | 4/30/26 | 16 | $5,850,000 | $365,625 | 5.50% | 2-building portfolio |
| 160 Ash Ave | Carpinteria | 6/12/26 | 7 | $4,850,000 | $692,857 | 4.79% | Blended STR income |
| 6597 Trigo Rd | Isla Vista | 4/24/26 | 10 | $3,975,000 | $397,500 | 5.66% | Student housing, 100% leased |
| 223 E Tunnell St | Santa Maria | 6/23/26 | 7 | $1,250,000 | $178,571 | 7.91% | 1940 casitas, sold 23% below list |
| 706-720 W 5th St | Oxnard | 4/20/26 | 18 | $4,480,000 | $248,889 | 4.90% | 1954 vintage |
| 293-295 W Park Row Ave | Ventura | 5/7/26 | 10 | $3,420,000 | $342,000 | 5.60% | 2BD/3BD mix |
| 175 Stimson Ave | Pismo Beach | 4/16/26 | 7 | $3,700,000 | $528,571 | 5.98% | Highest $/unit of Q2 |
| 2580 Main St | Cambria | 4/29/26 | 5 | $900,000 | $180,000 | — | Estate sale, as-is, under-rented |
*706-708 E Haley St is mixed-use (5 apartments + 3 commercial spaces); unit metrics are on an 8-unit basis and its 5.37% cap rate includes commercial income.
Rent Snapshot (CoStar, Q2 2026)
- Santa Barbara (metro): asking rents ~$2,900/unit, +1.2% year-over-year and decelerating; overall vacancy ~2.7%. City-covered units frozen at December 16, 2025 levels.
- Santa Maria: asking rents ~$2,360/unit, +1.3% year-over-year, recovering from 2025 declines; overall vacancy ~9% on new deliveries.
- Ventura County: asking rents ~$2,670/unit, -0.4% year-over-year — the only negative print on the Central Coast.
- San Luis Obispo: asking rents ~$2,745/unit, roughly flat year-over-year after leading the region at 2%+ through 2025.
Sources & Notes
Transaction data: Radius Group / Golis Team records (MLS, CoStar, public records); 5+ unit sales in Santa Barbara, Ventura, and SLO counties. Rates: Federal Reserve (FRED DGS10), daily, Q2 2026. Rent/vacancy context: CoStar market analytics, Q2 2026 (approximate). Ordinance status: City of Santa Barbara (Ord. 2026-6206; draft SBMC Ch. 26.90, June 10, 2026; adoption hearing July 28, 2026).
Multifamily Investments: 2–4 Units
Contribution by Aneta Jensen DRE #01994822 & Silas Burkey DRE #02328305
South Santa Barbara County | 2–4 Units (Excluding Isla Vista)
The second quarter of 2026 recorded 20 closed sales of 2–4 unit residential income properties across South Santa Barbara County, the segment’s most active quarter in over a year. Activity rose from 17 transactions in Q1 2026 and just 12 in Q2 2025, a 67% year-over-year increase confirming that the rebound that took shape earlier in the year has carried into the spring. Sixteen of the 20 sales closed in Santa Barbara, three in Goleta, and one in Carpinteria, while Summerland recorded no sales, once again underscoring how concentrated this market remains within the Santa Barbara core. The shift this quarter was the type of product that moved. After a first quarter dominated by duplexes (15 of 17 sales), the market rebalanced dramatically: ten duplexes and nine triplexes closed escrow, along with one fourplex. Triplex volume jumped from two sales to nine, the sharpest move of any category.
South SB County 2–4 Unit Quarterly Sales Comparison
| Q2 ’26 SALES | Q1 ’26 SALES | Q2 ’25 SALES | AVG PRICE (Q2 ’26) | AVG PPU (Q2 ’26) | PRIOR PPU (Q1 ’26) | Δ PPU (%) | |
|---|---|---|---|---|---|---|---|
| Duplex | 10 | 15 | 10 | $1,733,700 | $826,222 | $950,500 | –13.1% |
| Triplex | 9 | 2 | 1 | $1,835,097 | $611,699 | $585,801 | +4.4% |
| Fourplex | 1 | 0 | 1 | $2,040,000 | $510,000 | — | — |
| TOTAL | 20 | 17 | 12 |
Note: No fourplexes traded in Q1 2026. PPU averages exclude 330 W. Canon Perdido St, where the value of in-development ADUs distorts per-unit pricing.
Regulatory and Financing Environment
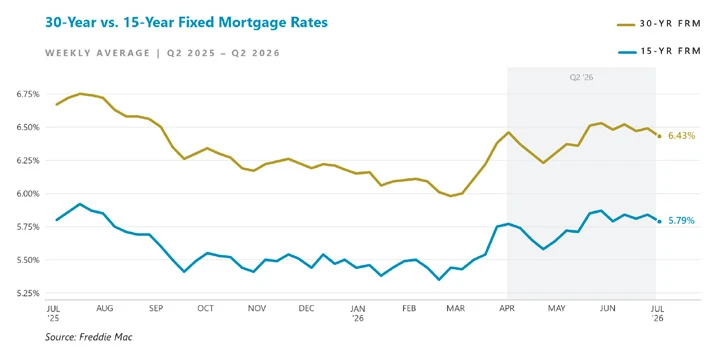
Momentum built even as financing costs ticked higher, with thirty-year mortgage rates drifting into the mid-6% range and the Federal Reserve on hold through its June meeting. The broader multifamily market remains in a state of adjustment as higher costs of capital and a tighter regulatory framework reset pricing expectations for larger, purely income-driven assets. The 2–4 unit segment has proven more resilient: buyers can pair residential financing with rental income, and many purchases carry an owner-user component. Meanwhile, the City of Santa Barbara’s Rent Stabilization Ordinance, layered over statewide AB 1482, keeps buyers focused on in-place income and vacancy at close of escrow. That scrutiny is producing a clear flight to quality: turnkey, well-located assets are commanding premiums and moving quickly, value-add product faces longer marketing periods and sharper price discovery, and vacancy itself has become a source of value, allowing a buyer to establish market rents from day one rather than inheriting regulated, below-market leases.
Sales Performance & Pricing Metrics
DUPLEXES 10 SALES | AVG. PRICE: $1,733,700 | AVG. PPU: $826,222
The quarter’s headline sale was 330 W. Canon Perdido Street, a 2011-built Andalusian-style corner duplex in downtown Santa Barbara that closed at $2,465,000, the highest price of any South County 2–4 unit transaction this quarter. Delivered with both 3-bedroom, 3-bath units vacant and two additional units in development, the sale pencils to $1,232,500 per unit on paper, though much of that figure reflects the ADU development underway rather than the standing units; originally listed at $2,995,000, it required a $500,000 reduction and 155 days on market to trade. On a like-for-like basis, the quarter’s per-unit benchmark belongs to 1129 San Pascual Street, a circa-1916 adobe built as the first home of noted architect John William Chard, which was vacant at sale, is reported to have gone under contract in five days, and closed at $2,245,000, or $1,122,500 per unit. At the other end of the range, 329 Santa Barbara Street, a probate offering, drew immediate attention at its price point and closed 1.5% over asking at $1,010,000, or $505,000 per unit. Goleta’s three duplex sales, concentrated in the Freeman Place / Linfield Place pocket, averaged $747,833 per unit, led by 475 Linfield Place at 105.5% of list, and Carpinteria’s lone sale, 4837 7th Street, closed modestly above asking at $950,000 per unit after three days on market.
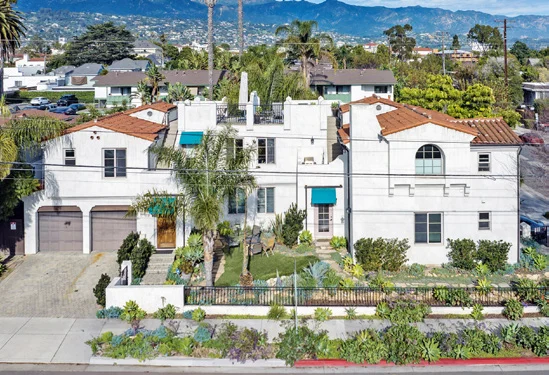
TRIPLEXES 9 SALES | AVG. PRICE: $1,835,097 | AVG. PPU: $611,699
Triplexes delivered the quarter’s biggest surprise: nine closed sales, up from two in Q1 2026 and a single transaction a year ago, all within the City of Santa Barbara, with average price per unit up 4.4% quarter-over-quarter. 2019 Castillo Street set the category high at $725,000 per unit; with three renovated two-bedroom units in excellent condition and reported income of roughly $12,100 per month, it sold 3.6% over asking in 10 days, the clearest example of this quarter’s flight to quality. The low end belonged to 2535 De La Vina Street at $491,667 per unit after 279 days on market and a price reduction, evidence that buyers are discounting value-add product as capital shifts toward stabilized, turnkey assets.
FOURPLEXES 1 SALE | PRICE: $2,040,000 | PPU: $510,000
2019 Bath Street was the only fourplex to trade in the past two quarters, closing at 97.1% of asking after 44 days with approximately $10,900 per month in place. It also recorded the lowest price per unit of any transaction this quarter, a reminder that per-unit pricing compresses as unit count rises and that fourplexes trade closer to pure income fundamentals.
South Santa Barbara County Market Summary
Across all 20 sales, the average transaction achieved 97.2% of its final list price and 93.9% of its original list price, but getting there took discipline: eight listings (40%) absorbed at least one price reduction before selling, averaging a $195,000 cut. Days on market averaged 59 against a median of 40, a market moving at two very different speeds, where well-located product with sound in-place economics transacts within weeks while listings priced ahead of buyer expectations sit for 100 to 279 days. Twenty-six 2–4 unit listings were active at some point during the quarter (11 duplexes, 7 triplexes, and 8 fourplexes), 15 of them new to market, and two went pending. Measured against 20 closed sales, that inventory represents roughly 3.9 months of supply, comfortably below the five-to-six month threshold generally viewed as a balanced market: a seller-favorable but selective environment in which pricing strategy, more than scarcity, is determining outcomes.
Future Outlook
Heading into the second half of the year, the fundamentals point to continued, if measured, momentum. Sales volume has risen both sequentially and year-over-year, buyer depth is broadening beyond duplexes into triplexes, and months of supply remain tight. If mortgage rates stabilize or begin to ease, we would expect that momentum to accelerate; in the meantime, the elevated cost of capital keeps working in favor of owner-users who can apply a second or third unit’s rent directly against their mortgage. Expect the flight to quality to persist: turnkey properties and those offering vacancy at close should continue to command premiums and transact quickly, while properties with below-market regulated rents, deferred maintenance, or tenant complexities trade at adjusted pricing as the market at large continues its adjustment to the Rent Stabilization Ordinance and today’s financing costs.
Isla Vista Student Housing SFR & 2–4 Unit Segment
Isla Vista’s student housing segment recorded six closed sales this quarter: four duplexes and two single-family homes. That compares with four closings in Q2 2025 and none in Q1 2026, when eight new listings came to market, but no sales closed. Duplex prices ranged from $1,680,000 to $2,500,000, averaging $2,064,250, or $1,032,125 per unit, a striking 46% premium over the $707,963 per-unit average across the South County’s other submarkets; the single-family sales averaged $1,556,500. The premium is structural. Supply is scarce and essentially static, demand is pushed steadily higher by UCSB’s consistent enrollment growth, and turnover is predictable, with much of the tenant base cycling roughly every three years. Student housing also sits on the favorable side of the regulatory divide: Isla Vista is governed by the comparatively less restrictive statewide AB 1482 rather than the City of Santa Barbara’s Rent Stabilization Ordinance, and units are re-leased annually following a structured two-week turnover period—natural turnover that lets owners bring rents to market level nearly every year.
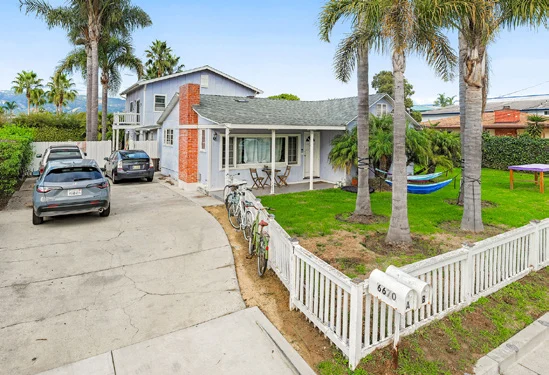
Del Playa Drive accounted for two of the six closings: 6516 Del Playa Drive, a duplex that closed at $2,227,000 ($1,113,500 per unit, 95.8% of asking), and 6553 Del Playa Drive, an oceanfront single-family home fully leased for the coming school year that closed at $1,518,000. Nothing in Isla Vista is far from the water, but Del Playa sits directly adjacent to the beach, an immediacy student tenants prize above all else, and product on the street trades rarely and at a premium. Elsewhere, 6670 Sueno Road was the quarter’s top sale at $2,500,000, or $1,250,000 per unit, on a rare 11,761 SF lot with expansion or redevelopment potential, while the sister Sabado Tarde Road duplexes, marketed together from late February, closed at $1,850,000 (2.8% over asking) and $1,680,000 (96% of list), both renovated for student occupancy and leased for the coming school year. 6877 Fortuna Road, a single-family home on the community’s western edge, closed at its full reduced asking price of $1,595,000.
The pipeline points to continued momentum. 6724 Pasado Road went pending in mid-May at a $2,795,000 asking price, after trading at $2,100,000 in Q2 2025, and closed shortly after quarter end. 6880 Pasado Road went under contract following the quarter, and new single-family listings joined the market late in the quarter on Del Playa Drive and Sueno Road.
Isla Vista 2–4 Unit Quarterly Sales Comparison
| Q2 ’26 SALES | Q1 ’26 SALES | Q2 ’25 SALES | AVG PRICE (Q2 ’26) | AVG PPU (Q2 ’26) | PRIOR PPU (Q2 ’25) | Δ PPU (%) | |
|---|---|---|---|---|---|---|---|
| SFR | 2 | 0 | 2 | $1,556,500 | $1,556,500 | $1,867,500 | –16.7% |
| Duplex | 4 | 0 | 1 | $2,064,250 | $1,032,125 | $1,050,000 | –1.7% |
| Fourplex | 0 | 0 | 1 | — | — | $750,500 | — |
| TOTAL | 6 | 0 | 4 |
Note: No Isla Vista properties traded in Q1 2026; prior PPU reflects Q2 2025, the most recent quarter with closed sales. SFR figures reflect single-family homes operated as student rentals.
Future Outlook
The conditions behind this quarter’s results are durable: enrollment-driven demand, effectively fixed supply, and a regulatory framework that preserves the annual reset to market rents. With the Pasado Road transactions already extending activity into the third quarter and fresh inventory testing the market, Isla Vista student rentals, duplex or single-family, remain among the most reliable performers on the South Coast.